Optimocracy: Causal Inference on Cross-Jurisdictional Policy Data to Maximize Median Health and Wealth

Thousands of jurisdictions (municipal, state, federal, international) have exposed populations to different policies over decades. This cross-jurisdictional variation is a natural experiment. Optimocracy: (1) Apply causal inference to this historical policy data, (2) Identify which policies predict above-average median income and healthy life years, (3) Publish recommendations for every major vote, (4) Track politician alignment with evidence. Politicians still decide; the scoreboard just records what they decided and what it cost. Acting on the scoreboard is a separate problem, and this paper surveys the available mechanisms rather than assuming one. At system scale, the Optimal Governance Trajectory reaches 56.7x (95% CI: 21x-148x) the Earth baseline after 20 years, raises average income to $1.16 million (95% CI: $429,664-$3.04 million) versus $20,483 on the status-quo path, reaches $10.7 quadrillion (95% CI: $3.95 quadrillion-$28 quadrillion) in total output, and recovers roughly $101 trillion (95% CI: $59.6 trillion-$161 trillion)/year in suppressed value (The Political Dysfunction Tax).
mechanism design, algorithmic governance, metric optimization, capture resistance, Goodhart’s Law, independent verification
The Mechanism
Optimocracy is simple:
- Exploit cross-jurisdictional variation as natural experiments: Thousands of jurisdictions have made different policy and budget choices over decades. When Kansas cuts education funding and Minnesota increases it, that’s a natural experiment. Apply causal inference methods (synthetic control, difference-in-differences, regression discontinuity) to estimate what happened to median real after-tax income and healthy life years.
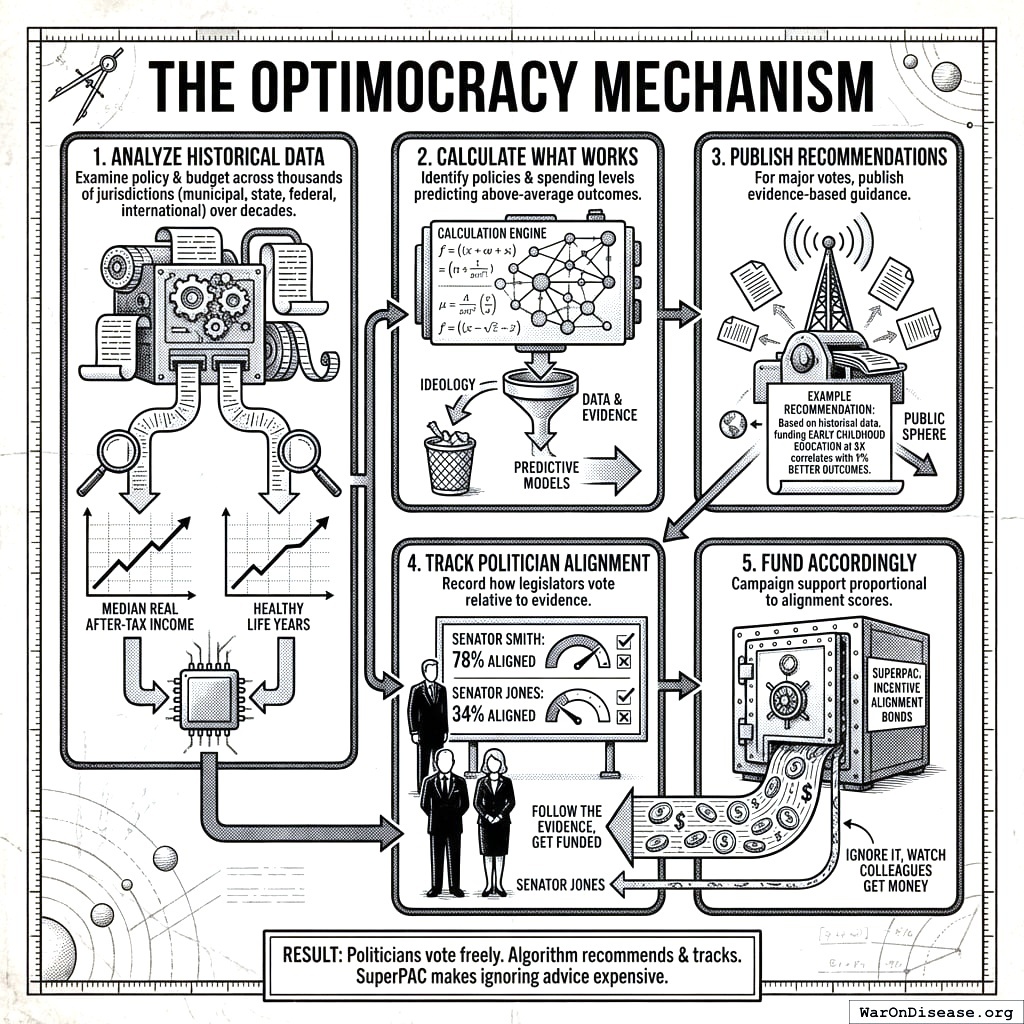
Identify which policies predict above-average outcomes: Not ideology. Not theory. Which specific policy choices, across hundreds of jurisdictions and decades of data, causally predicted higher median income and more healthy life years?
Publish recommendations: For every major vote, publish what the evidence suggests. “Based on historical data, funding early childhood education at $X correlates with Y% better outcomes.”
Track politician alignment: When legislators vote, record how often they align with evidence-based recommendations. Senator Smith: 78% aligned. Senator Jones: 34% aligned.
That’s it. Politicians still vote however they want. The algorithm recommends, and then it records.
That leaves the second problem, which is getting anyone to act on the record. Published evidence is necessary and, on the historical record, not sufficient: Why Information Alone Fails documents rankings that have existed for years and moved little. Several mechanisms could close that gap, they have different costs and different failure modes, and Political Economy works through them. This paper does not assume one. The analytical engine is the contribution; the adoption mechanism is a choice made afterward, and choosing wrong does not make the measurements wrong.
Scale note. The magnitude at stake is far larger than any single reform memo. Under the project’s best-case governance ceiling, the recoverable upside is $101 trillion (95% CI: $59.6 trillion-$161 trillion) per year. Over 20 years, the Optimal Governance Trajectory reaches 56.7x (95% CI: 21x-148x) the Earth baseline, raises average income to $1.16 million (95% CI: $429,664-$3.04 million) versus $20,483 on the status-quo path, and reaches $10.7 quadrillion (95% CI: $3.95 quadrillion-$28 quadrillion) in total output. This paper focuses on the evidence-production and enforcement layer that could move policy toward that ceiling; the full derivation lives in The Political Dysfunction Tax55.
Why This Works
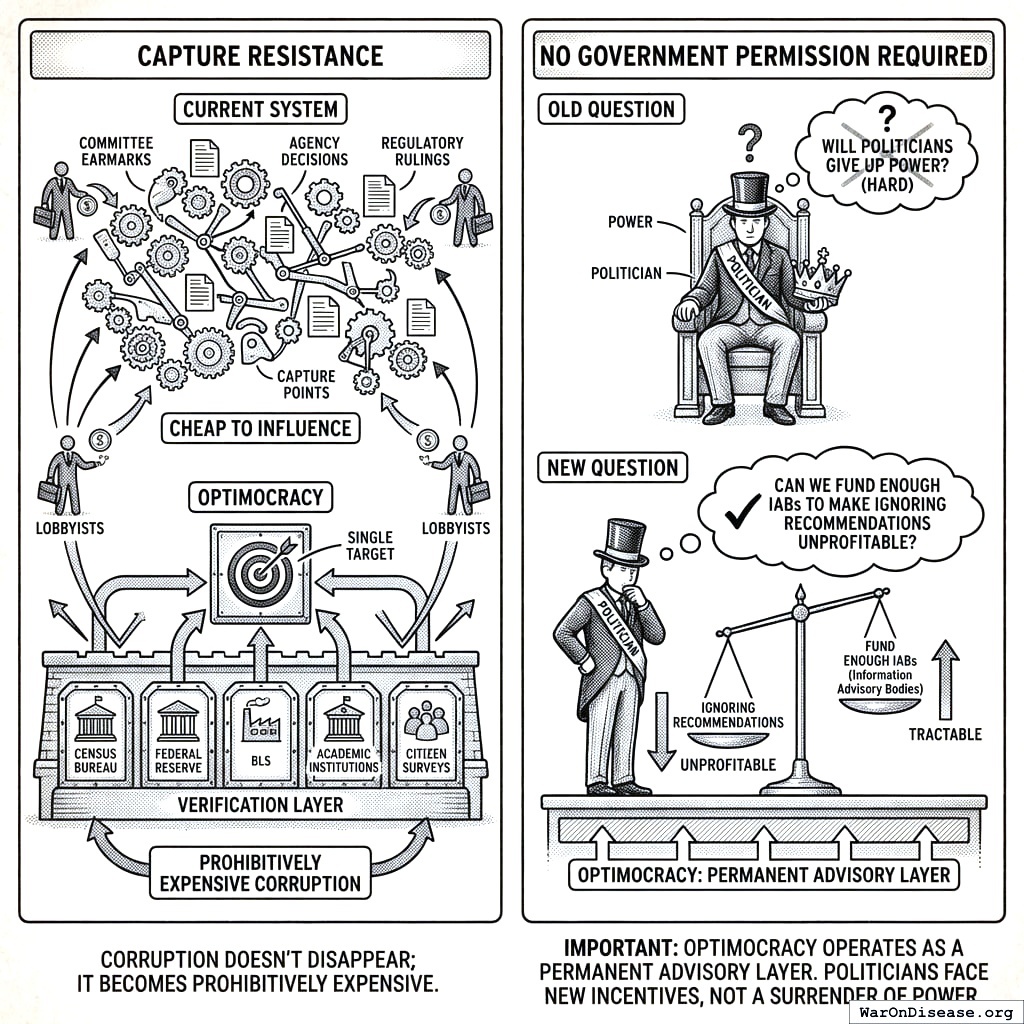
Capture resistance: Currently, lobbyists have thousands of capture points: committee earmarks, agency decisions, regulatory rulings. Each is relatively cheap to influence. Optimocracy consolidates these to a single target: the verification layer measuring health and wealth. Corrupting five independent data sources (Census Bureau, Federal Reserve, BLS, academic institutions, citizen surveys) requires coordination across institutions with different governance structures, funding sources, and methodologies. Corruption doesn’t disappear; it just becomes prohibitively expensive.
Analytical validity: Cross-jurisdictional variation provides the statistical power that single-jurisdiction studies lack. When 50 states adopt different minimum wages over 30 years, we don’t need a randomized trial; we have thousands of natural experiments. Modern causal inference methods (synthetic control, difference-in-differences) can extract signal from this variation. The approach has already produced actionable findings in economics and public health; Optimocracy systematizes it across all policy domains simultaneously.
No government permission required: Optimocracy operates as a permanent advisory layer. Running a regression on published data and comparing the result to a published roll-call vote is information provision. No legislature has to authorize it, no agency has to adopt it, and no politician has to surrender anything to be measured. The question changes from “Will politicians give up power?” (hard) to “Will anyone act on an accurate scoreboard?” (still hard, but a different problem, and one with more than one answer).
The Problem: Political Dysfunction Tax
Political actors optimize for what gets them reelected: campaign contributions, constituent services, ideological positioning. These differ systematically from what improves measured outcomes. The result: systematic resource misallocation costing $4.98 trillion (95% CI: $4.39 trillion-$5.61 trillion) in documented US waste and $101 trillion (95% CI: $59.6 trillion-$161 trillion) in global opportunity costs. For full derivation, see The Political Dysfunction Tax.
Why Information Alone Fails
Rankings of government programs by cost-effectiveness already exist. The Copenhagen Consensus publishes rigorous benefit-cost analyses: childhood vaccinations (101:1 BCR), e-government procurement (125:1), maternal health interventions (87:1). GiveWell, Open Philanthropy, and academic institutions produce similar analyses.
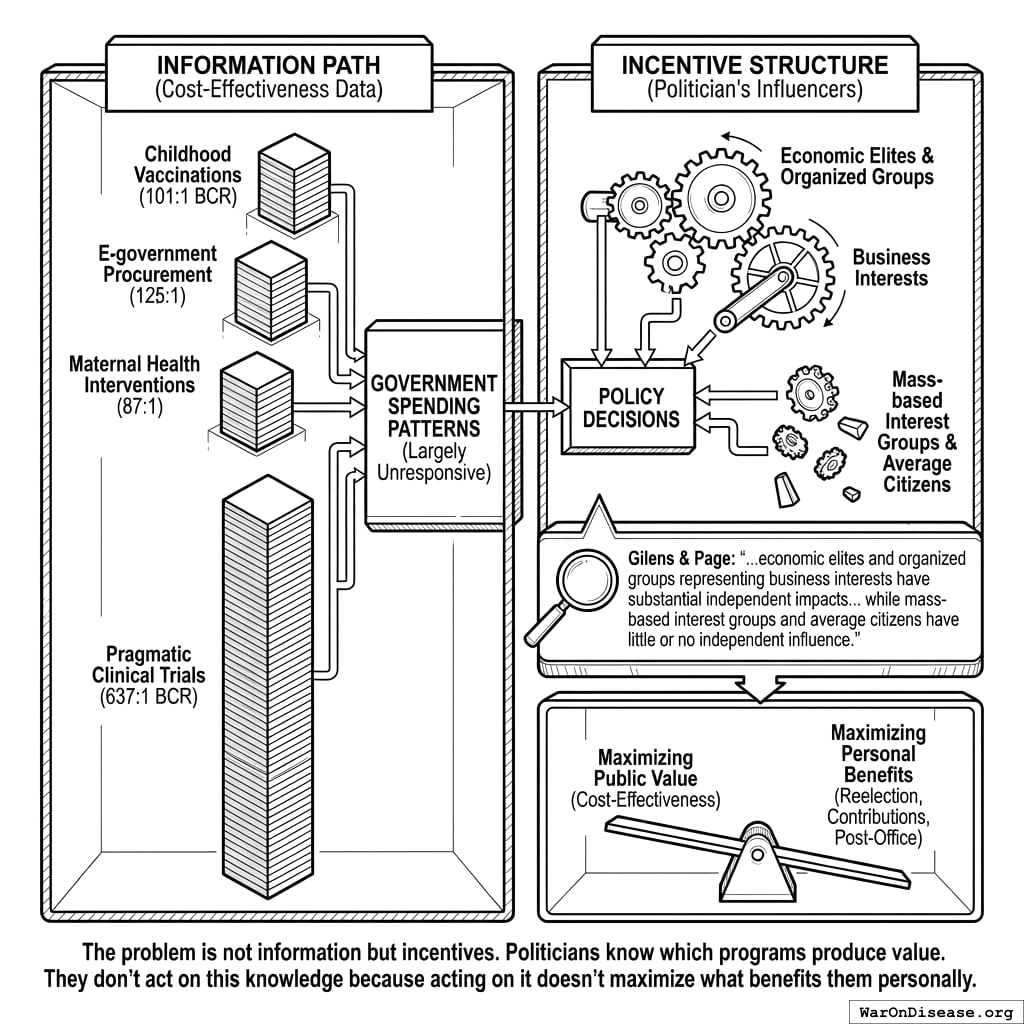
Yet government spending patterns remain largely unresponsive. Gilens and Page136 analyzed 1,779 policy decisions: “economic elites and organized groups representing business interests have substantial independent impacts on U.S. government policy, while mass-based interest groups and average citizens have little or no independent influence.”
The problem is not information but incentives. Politicians know which programs produce value. They don’t act because acting doesn’t maximize reelection probability, campaign contributions, or post-office career prospects.
The Scale of Welfare Loss: Empirical Foundations
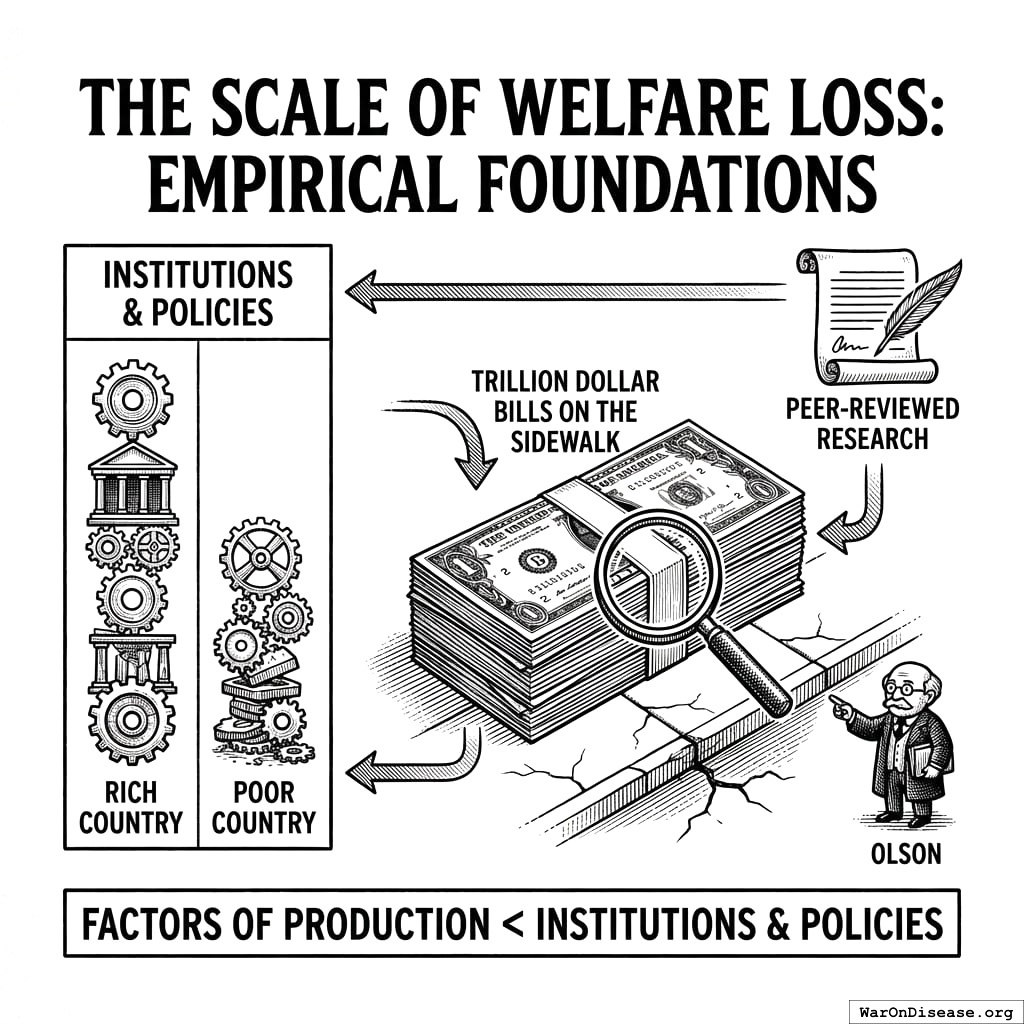
Before proposing solutions, we must establish the magnitude of the problem. This section synthesizes peer-reviewed research documenting welfare losses from suboptimal policy. The metaphor “trillion dollar bills on the sidewalk” comes from137, who showed that differences between rich and poor countries are primarily due to institutions and policies, not factors of production.
Quantifying the Political Dysfunction Tax
Let \(W^*\) represent maximum achievable welfare under optimal policy, and \(W\) represent actual welfare under current policy. We define the Political Dysfunction Tax as:
\[ \tau_{dysfunction} = \frac{W^* - W}{W^*} = 1 - \frac{W}{W^*} \]
We estimate this tax through forensic accounting of documented policy failures. The methodology and sources are detailed in The Political Dysfunction Tax. The damage report:
| Scope | Amount | As % of GDP |
|---|---|---|
| US Waste Ledger (burned capital) | ||
| Global Opportunity Ledger (unrealized potential) | ||
| Global Efficiency Score | (dimensionless) |
The welfare loss can be conceptually decomposed into sources:
- Crony Tax (\(\tau_{crony}\)): Resources flowing to concentrated interests rather than outcome-maximizing alternatives. Del Rosal138 surveys empirical estimates ranging 0.2% to 23.7% of GDP.
- Short-Termism Cost (\(\tau_{time}\)): Politicians facing re-election in 4 years systematically underinvest in goods that pay off over 10-30 years: basic research, infrastructure maintenance, pandemic preparedness, climate mitigation.
- Ignorance Cost (\(\tau_{information}\)): Decision-makers lacking dispersed local knowledge that markets aggregate139.
- Gridlock Cost (\(\tau_{coordination}\)): Diffuse beneficiaries cannot organize against concentrated interests137.
Optimocracy primarily addresses \(\tau_{crony}\) and \(\tau_{time}\) by making evidence-based recommendations public and rewarding politicians (via campaign support and career opportunities) in proportion to their alignment with those recommendations.
Documented Welfare Losses by Policy Domain
The following table synthesizes estimates from peer-reviewed research:
| Policy Domain | Source | Methodology | Estimated Welfare Loss | Confidence |
|---|---|---|---|---|
| US regulatory accumulation (1980-2012) | 140 | Counterfactual growth trajectory | 25% of GDP ($4T annually) | Low† |
| US regulation (1949-2005) | 141 | Panel regression, regulatory index | GDP would be 3.5x higher | Low† |
| Global corruption | 142 | Multiple estimation approaches | 5% of GDP (~$5T/year) | Medium |
| FDA drug delays (1960-2001) | 143 | Consumer/producer surplus | 140M life-years lost | Medium |
| Trade barriers | 144 | Gravity models | 5-10% of GDP | High |
| Occupational licensing | 145 | Labor market distortion | 2-3% of GDP | High |
†Think tank source with weak causal identification; achievable gains likely smaller.
Note on interpretation: These estimates are not additive; many inefficiencies interact and overlap. However, even conservative aggregation suggests the Political Dysfunction Tax amounts to 17.3% (95% CI: 15.3%-19.5%) of US GDP in documented waste.
This pattern (massive welfare losses persisting due to political economy constraints) recurs across policy domains. The question is not whether trillion-dollar bills exist, but why they remain on the sidewalk.
Calibrating the estimates: These theoretical maxima require heroic assumptions. Regulatory estimates from think tanks use weak causal identification; 5-10% is more defensible than 25%. After adjusting:
- Regulatory reform: 5-10% of GDP (not 25%)
- Corruption reduction: 3-5% of GDP
- Other allocative improvements: 5-10% of GDP
Conservative aggregate: 17.3% (95% CI: 15.3%-19.5%) of US GDP in documented waste ($4.98 trillion (95% CI: $4.39 trillion-$5.61 trillion)), with global opportunity costs reaching $101 trillion (95% CI: $59.6 trillion-$161 trillion). This is sufficient to motivate Optimocracy, without relying on heroic assumptions.
Bottom-Up Policy Cost Accounting
The US government waste estimate of $4.98 trillion (95% CI: $4.39 trillion-$5.61 trillion) (17.3% (95% CI: 15.3%-19.5%) of GDP) is derived from the United States Efficiency Audit146, which enumerates specific, measurable policy failures across defense, healthcare, justice, regulatory, and subsidy subsystems.
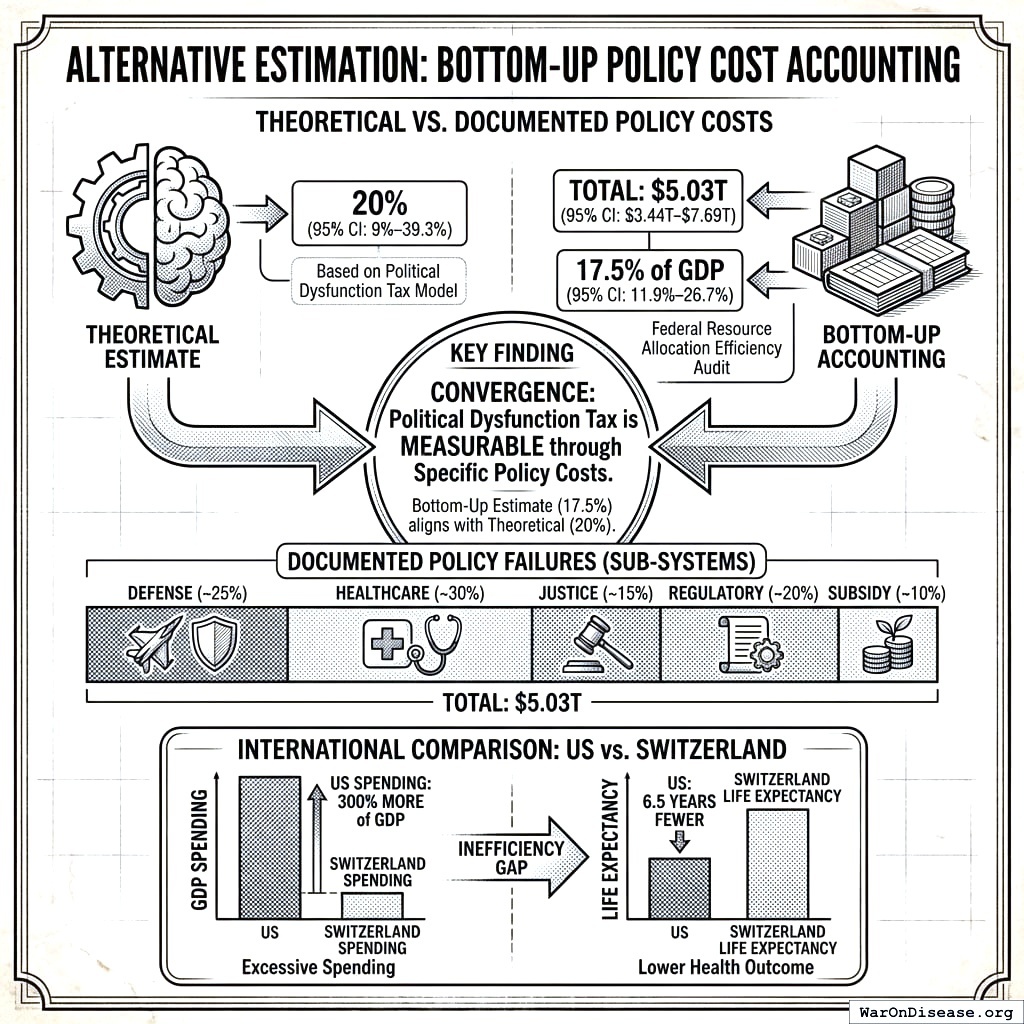
International comparisons reinforce this estimate: the US spends 300% percentage points MORE of GDP than Switzerland yet achieves 6.5 years FEWER years of life expectancy.
Why Information Doesn’t Solve the Problem
If the welfare losses are documented, why don’t governments act? As established in the Introduction, the problem is incentives, not information.136 found that economic elites and organized interests, not average citizens, drive policy outcomes. This explains the persistence of obvious inefficiencies:
| Intervention | Benefit-Cost Ratio | Political Economy |
|---|---|---|
| Pragmatic clinical trials | 637 (95% CI: 479-854):1 | No concentrated beneficiary; competes with traditional trial industry |
| Childhood vaccination | 101:1 | No concentrated beneficiary to lobby |
| Pandemic preparedness | 100:1+ | Benefits are diffuse and probabilistic |
| Medical research | 45:1 | Competes with defense spending |
| Agricultural subsidies | <1:1 | Concentrated beneficiaries, effective lobby |
Information about optimal policy is freely available. The Copenhagen Consensus, GiveWell, and academic researchers publish rigorous benefit-cost analyses. Governments ignore this information because acting on it is not politically rewarded.
Implications for Mechanism Design
The empirical evidence suggests:
- The welfare loss is massive: Documented US waste alone totals $4.98 trillion (95% CI: $4.39 trillion-$5.61 trillion) (17.3% (95% CI: 15.3%-19.5%) of GDP).
- Information alone is insufficient: Better data does not change political incentives.
- The inefficiency is systematic: It recurs across domains and countries, suggesting structural rather than contingent causes.
- Capture is the primary mechanism: Policies systematically favor concentrated interests over diffuse citizen welfare.
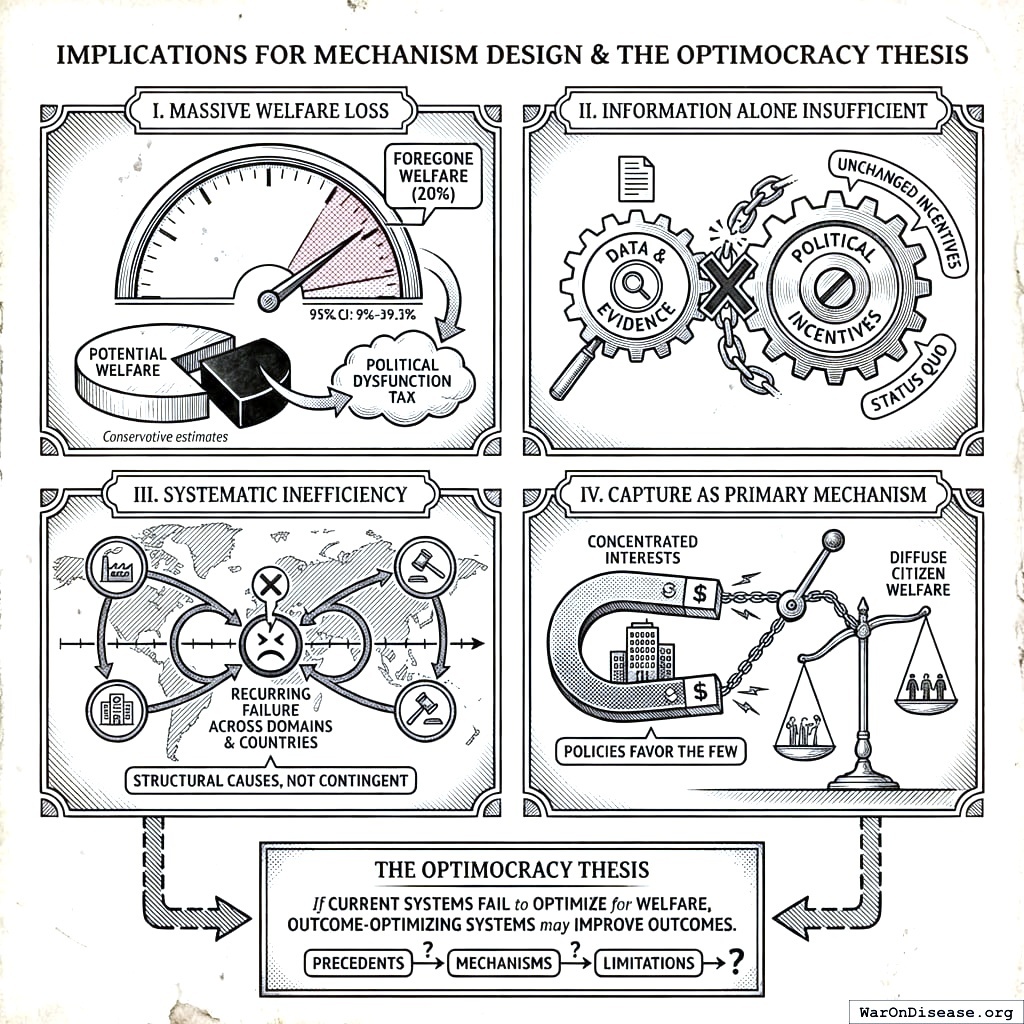
This motivates the Optimocracy thesis: if current systems systematically fail to optimize for welfare, outcome-optimizing systems may improve outcomes. The following sections examine precedents, mechanisms, and limitations.
When Does Optimocracy Beat the Status Quo?
Optimocracy’s structural advantage comes from consolidating capture opportunities. The only attack surface is the verification layer itself: coordinating multiple independent institutions to misreport the same metrics, without detection.
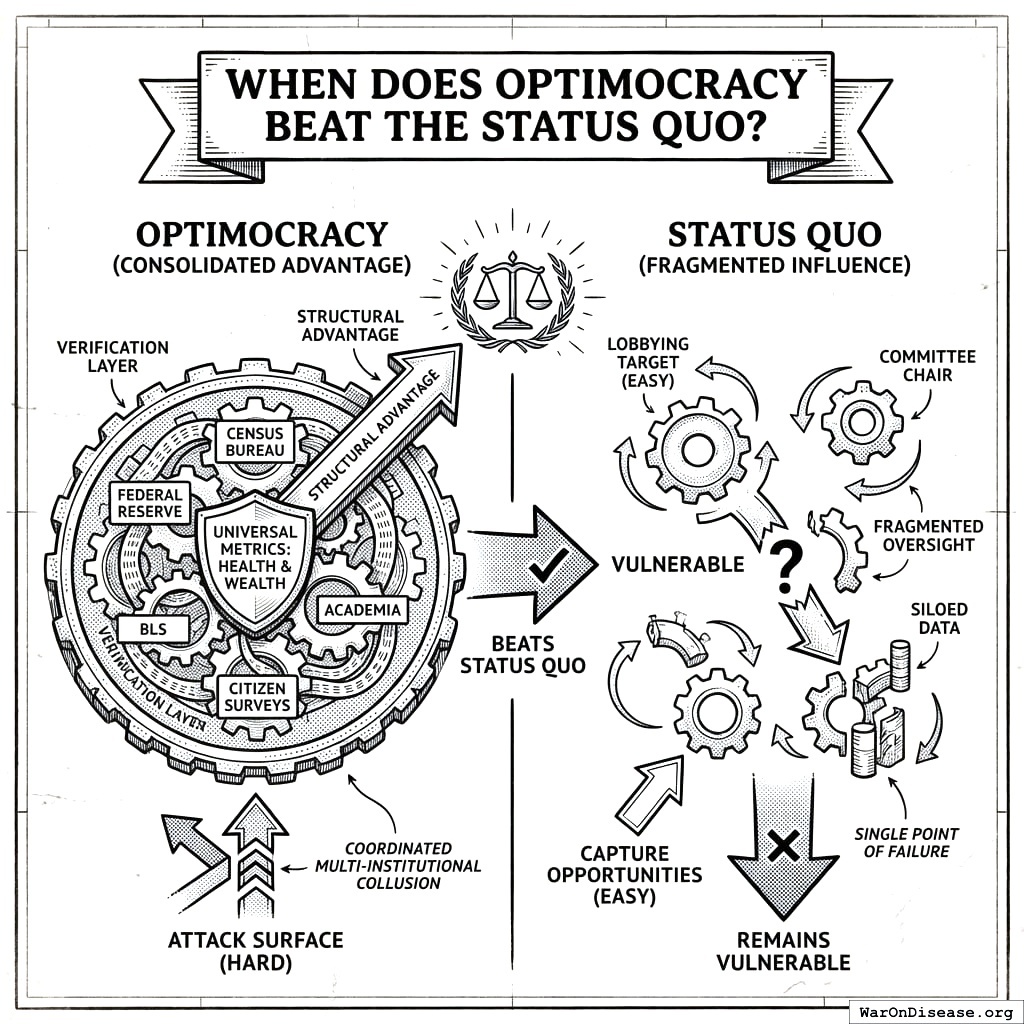
Health and wealth are not arbitrary metrics. They are what humans universally value. The challenge for would-be corruptors: coordinate the Census Bureau, Federal Reserve, BLS, academic researchers, and citizen surveys to all report the same biased figure, without any whistleblowers. These institutions have different governance structures, funding sources, and methodologies. Collusion among strangers who lose credibility if caught is fundamentally harder than lobbying a single committee chair.
Formal Model
Let \(N\) denote the number of capture-prone allocation decisions under the status quo. Each decision \(i\) has capture probability \(p_i\) and capture cost \(c_i\) (welfare loss when captured). Under Optimocracy, capture opportunity collapses to oracle manipulation: \(K\) independent oracles, each with capture probability \(p_O\), requiring majority collusion.
Proposition 1 (Optimocracy Dominance Condition):
Optimocracy beats capture-prone governance when:
\[ \underbrace{\binom{K}{\lceil K/2 \rceil} p_O^{\lceil K/2 \rceil} \cdot c_O}_{\text{Expected capture cost under Optimocracy}} < \underbrace{\sum_{i=1}^{N} p_i \cdot c_i}_{\text{Expected capture cost under status quo}} \]
In plain English: the left side is the cost of corrupting Optimocracy (coordinating oracle collusion across multiple independent sources). The right side is the cost of corrupting the status quo (bribing all those committee decisions). Optimocracy wins when the left side is smaller.
When this works:
- N is large: More decision points = more capture opportunities = higher status quo corruption cost
- Many independent oracles: More oracles require exponentially harder collusion (5 sources means capturing 3; probability scales as \(p_O^3\))
- Oracles are genuinely independent: Different governance structures, funding sources, methodologies
What the model shows: The magnitude of Optimocracy’s advantage depends on empirical parameters (capture probabilities, number of decision points, oracle independence). The model doesn’t prove Optimocracy always wins. It identifies the conditions under which consolidating decision points reduces capture.
Limitations: This model assumes capture probabilities are independent (may underestimate coordinated attacks) and oracle collusion requires simple majority (stronger thresholds reduce risk further). Real-world calibration is essential before drawing quantitative conclusions.
Theoretical Foundations
Previous attempts at technocratic governance (Soviet central planning, credit rating agencies) failed due to knowledge problems, incentive misalignment, and scope creep. Optimocracy learns from these failures by using median aggregation across independent data sources, limiting scope to budget/policy recommendations (not comprehensive planning), and preserving market mechanisms for production decisions. For detailed historical analysis and engagement with Arrow’s impossibility theorem, mechanism design theory, and democratic legitimacy concerns, see Appendix B.
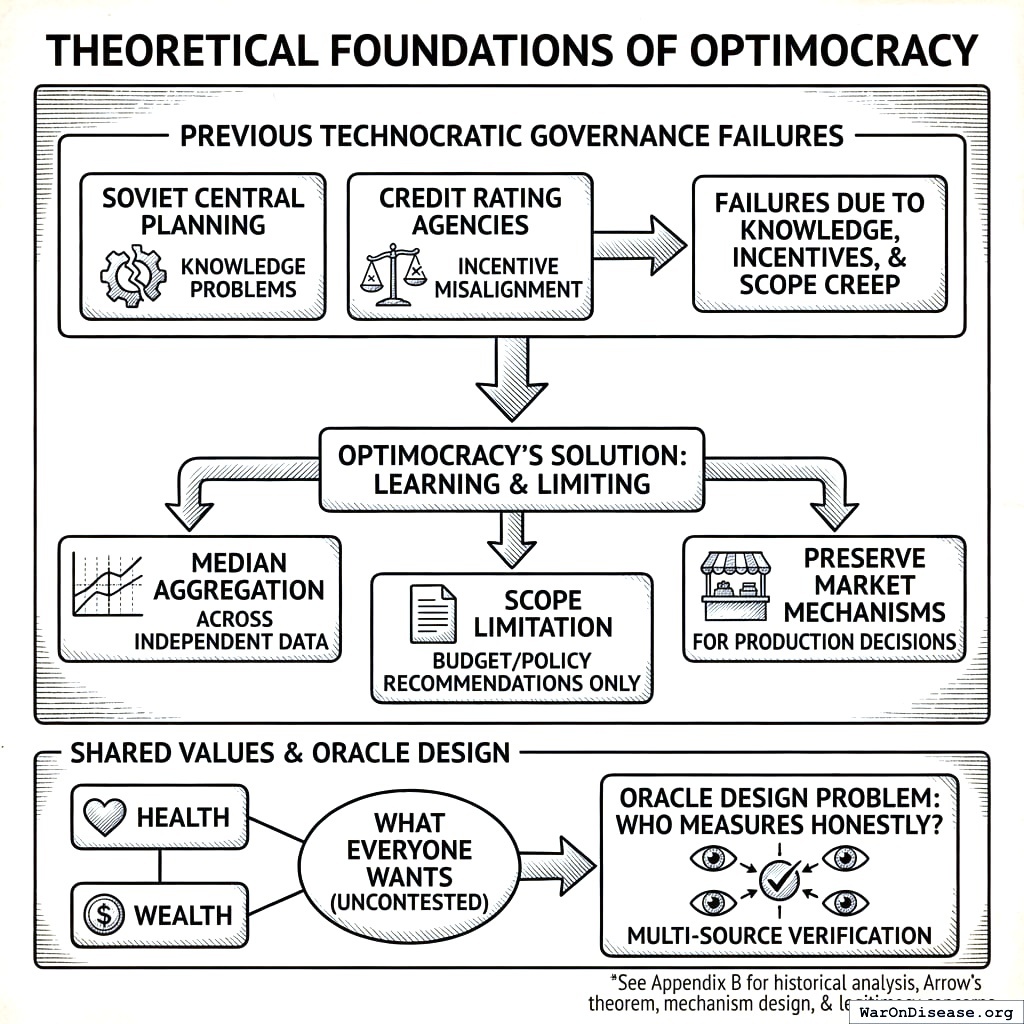
Critically, Optimocracy also avoids the Soviet knowledge problem because it does not plan from first principles. It learns from decentralized experiments that already happened. Thousands of jurisdictions have already tried different policies; Optimocracy uses causal inference to identify which choices led to better outcomes. This is empirical pattern recognition across natural experiments, not central planning.
Health and wealth aren’t contested values requiring democratic selection. They’re what everyone already wants. The hard problem isn’t “what should we optimize?” but “who measures it honestly?” That’s an oracle design problem, addressed through multi-source verification.
Precedents That Work
Rule-based allocation: Systematic approaches consistently outperform discretionary judgment across domains. Over 15-year periods, 90%+ of active fund managers underperform benchmark indices after fees147. Formula-based programs like Social Security COLA remove annual political battles over adjustments.
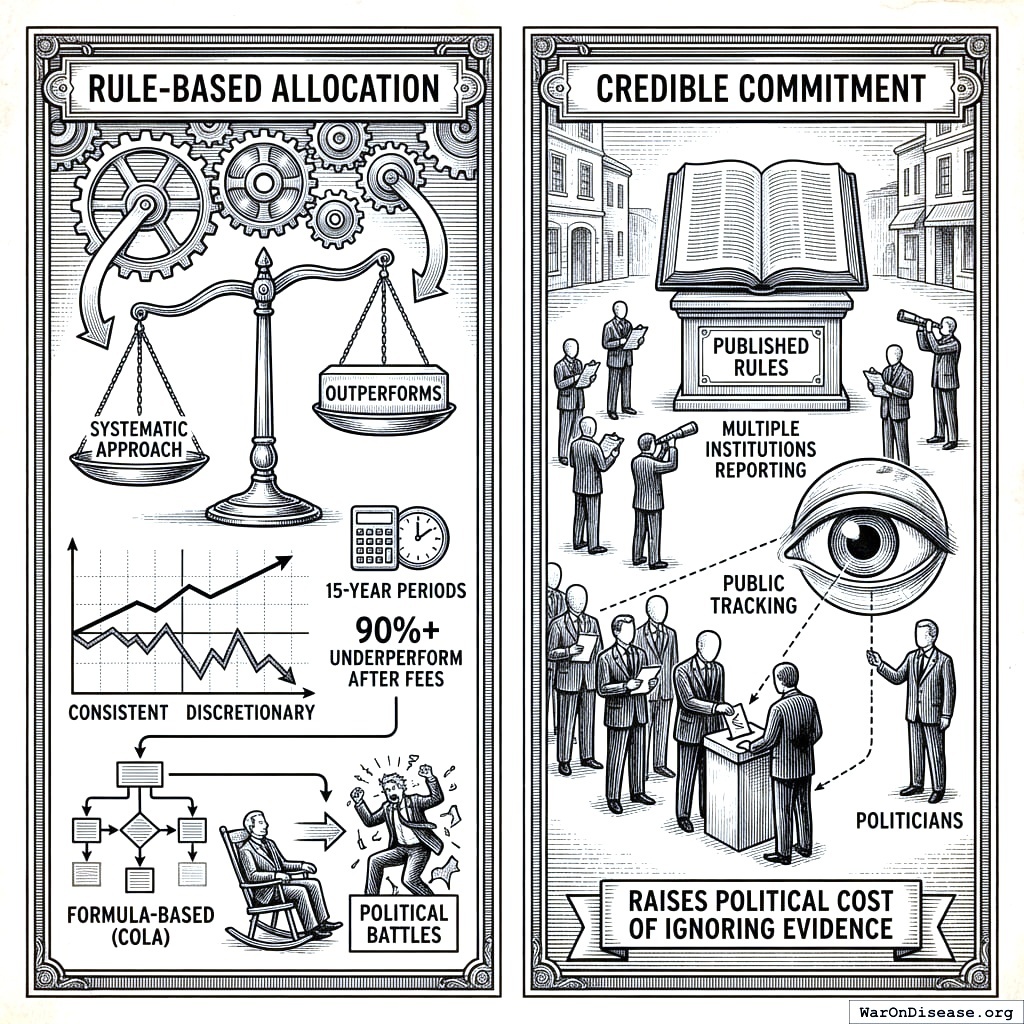
Credible commitment: Published rules make deviation visible. Multiple institutions report outcomes. Politicians vote freely, but alignment with recommendations is tracked publicly. This raises the political cost of ignoring evidence.
Mechanism Design
Architecture Overview
Optimocracy is purely advisory. It operates through three functions:
┌─────────────────────────────────────────────────────────┐
│                    RECOMMEND                             │
│  - Algorithm calculates optimal policies/budgets        │
│  - Optimizes for Health & Wealth (universal values)     │
│  - Publishes recommendations for every major vote       │
└─────────────────────────────────────────────────────────┘
                          │
                          ▼
┌─────────────────────────────────────────────────────────┐
│                      TRACK                               │
│  - Politicians vote however they want                   │
│  - System records alignment with recommendations        │
│  - Voting records are public                            │
└─────────────────────────────────────────────────────────┘
                          │
                          ▼
┌─────────────────────────────────────────────────────────┐
│                      REWARD                              │
│  - Adoption mechanism converts score into support       │
│  - 80% aligned = 2x the support of 40% aligned          │
│  - Metric trends validate the system, attract funding   │
└─────────────────────────────────────────────────────────┘
What about edge cases, catastrophic risks, novel situations? Politicians handle them. That’s their job. The algorithm recommends; politicians decide. If a recommendation seems dangerous or wrong, they ignore it and face public accountability for that choice. The system tracks and rewards, nothing more.
The Verification Layer
Verification systems translate real-world outcomes into data that allocation algorithms can act upon. The critical design challenge is verification capture: if a single entity controls the data feed, they effectively control the allocation.
Concrete example (measuring median income growth):
| Oracle | Source | Reported Value |
|---|---|---|
| Census Bureau | American Community Survey | +2.1% |
| Federal Reserve | Survey of Consumer Finances | +2.3% |
| Bureau of Labor Statistics | Current Population Survey | +1.9% |
| University of Michigan | Panel Study of Income Dynamics | +2.2% |
| Tax Foundation | IRS data analysis | +2.0% |
Aggregation: Take the median of all five sources → +2.1%
If one source reported +5.0% (an outlier), it would be excluded by the median. The system doesn’t require trust in any single institution, only that a majority aren’t colluding. Since these institutions have different governance structures, funding sources, and methodologies, coordinated manipulation is difficult.
The correlated data problem and its solution:
An important limitation: the five sources above all ultimately rely on the same underlying data (Census surveys, tax records, employer reports). Their errors are correlated, meaning “five independent sources” may be an illusion. If the underlying methodology is captured, all five report the same biased figure.
This is a real concern. The solution is genuinely independent data collection via decentralized citizen surveys.
Decentralized Survey Architecture:
| Component | Implementation | Why It Works |
|---|---|---|
| Identity verification | National digital ID, bank KYC, or similar | Prevents fake-identity attacks (one person = one response) |
| Data collection | Standard web/mobile interface | No technical expertise required |
| Storage | Secure database with audit logs | Can’t be retroactively altered without detection |
| Aggregation | Open-source algorithm | Transparent, anyone can verify |
| Privacy | Anonymization after identity verification | Responses can’t be linked to individuals |
Why individual gaming is irrelevant:
With millions of survey responses, one person lying has approximately zero impact on the aggregate. Survey responses are aggregated statistically, so there is no strategic incentive to misreport.
The Execution Layer
Given the objective function and data feeds, the execution layer performs constrained optimization:
\[ \max_{\mathbf{x}} M(\mathbf{x}) \quad \text{subject to} \quad \sum_i x_i = B, \quad x_i \geq 0 \]
Where \(M(\cdot)\) is the chosen metric, \(\mathbf{x}\) is the allocation vector, and \(B\) is the total budget.
The primary analytical engine uses causal inference on cross-jurisdictional time-series data: synthetic control methods, difference-in-differences, and regression discontinuity designs applied to decades of policy variation across thousands of jurisdictions. This is the core of Optimocracy: not theoretical modeling, but empirical identification of which real-world policy choices actually predicted better outcomes.
Supplementary methods include:
- Randomized controlled trials: Allocate experimental budgets to estimate causal effects of novel interventions with no historical variation to learn from
- Prediction markets: Aggregate distributed information about allocation effectiveness for forward-looking decisions
- Machine learning: Identify complex nonlinear patterns in the cross-jurisdictional dataset that traditional econometric methods may miss
The execution system publishes recommendations and tracks politician alignment. The alignment score is the input any adoption mechanism acts on, and the layer is indifferent to which one does. Outcome measurement validates the system over time.
For a concrete worked example of how the optimization algorithm calculates allocations, see Appendix A: Technical Specification Sketch.
Welfare Metrics
Default Implementation: Two-Metric Welfare Function
For practical implementation, the Optimocracy framework provides a simplified two-metric system that captures core welfare dimensions without requiring complex conversion factors or contested weighting decisions:
Metric 1: Real After-Tax Median Income Growth
- Definition: Year-over-year percentage change in inflation-adjusted, post-tax median household income
- Units: Percentage points per year (pp/year)
- Sources: Census Bureau, BLS, national statistical offices
- Why median: Captures typical citizen welfare without billionaire skew
- Why after-tax: Reflects actual purchasing power after government transfers
- Why growth rate: Enables cross-jurisdiction comparison regardless of baseline
Metric 2: Median Healthy Life Years
- Definition: Expected years of life in good health at the population median
- Units: Years
- Sources: WHO Global Health Observatory, national health surveys (BRFSS in US)
- Relationship to QALYs: Healthy life years ≈ life expectancy × average health utility
The Welfare Function
\[ W_j = \alpha \cdot \text{IncomeGrowth}_j + (1-\alpha) \cdot \text{HealthyYears}_j \]
Default weighting: \(\alpha = 0.5\) (equal weight to economic and health welfare). Alternative weightings can be selected through democratic process.
Why These Two Metrics Work
Most policy effects eventually show up in one or both:
| Policy Domain | How It Flows Through Real After-Tax Median Income |
|---|---|
| Employment | More jobs → higher wages → higher median income |
| Tax policy | Directly changes after-tax income |
| Transfer programs | Social Security, EITC → directly change after-tax income |
| Cost of living | Inflation adjustment captures housing, food, healthcare costs |
| Market power | Monopoly pricing → lower real income |
| Education quality | Better skills → better wages → higher income |
| Crime/instability | Lower productivity → lower wages |
| Trade policy | Consumer prices, job markets → flow through income |
If GDP rises but median after-tax income doesn’t, the policy correctly registers as low-welfare. Gaming this metric is hard because it requires actually improving typical household purchasing power.
| Policy Domain | How It Flows Through Median Healthy Life Years |
|---|---|
| Healthcare access | More treatment → longer healthier life |
| Environmental regulation | Less pollution → fewer respiratory/cancer deaths |
| Occupational safety | Fewer workplace injuries/deaths |
| Mental health policy | Suicide prevention, addiction treatment → life years |
| Public safety | Lower homicide/accident rates → life years |
| Lifestyle policy | Tobacco/alcohol taxes → behavioral health |
| Elder care | Quality of late-life health |
| Food safety | Fewer foodborne illness deaths |
Using median (not mean) avoids distortion from extremes like infant mortality or billionaire longevity clinics. It captures what a typical person can expect.
Why Two Metrics Beat Long Indicator Lists
Why not track 50 outcomes instead of 2? Three reasons:
Gaming multiplies: Each additional target creates a new way to cheat. Two broad, hard-to-fake outcomes are easier to audit than 50 narrow ones.
Errors compound: Composite indices (like HDI’s 11 indicators) aggregate noise. Disagreements over weights become proxy wars for policy preferences.
Veto points accumulate: With 50 metrics, every policy “harms” something. Analysis paralysis replaces action.
Markets figured this out: firms optimize profit, not 200 sub-metrics. Profit combines customer satisfaction, efficiency, and innovation into one number. These two welfare metrics do the same for policy.
What This Covers
Most policies affect one or both metrics:
- Economic policies (taxes, regulations, trade) primarily affect income growth
- Health policies (healthcare access, public health, safety) primarily affect healthy life years
- Many policies (education, infrastructure) affect both
What about edge cases? Politicians handle them. Optimocracy is purely advisory. If a recommendation seems to violate rights, increase catastrophic risk, or harm minorities, politicians ignore it. That’s their job. The algorithm recommends what maximizes health and wealth; politicians decide whether to follow.
This two-metric system is used by both the Optimal Policy Generator148 for policy recommendations and the Optimal Budget Generator149 for spending targets, ensuring consistency across the Optimocracy framework.
Advantages Over Political Governance
Capture Resistance
Under current governance, 12,000+ federal lobbyists spend $4+ billion annually with estimated 100:1 returns150. Every budget line item is a lobbying opportunity.
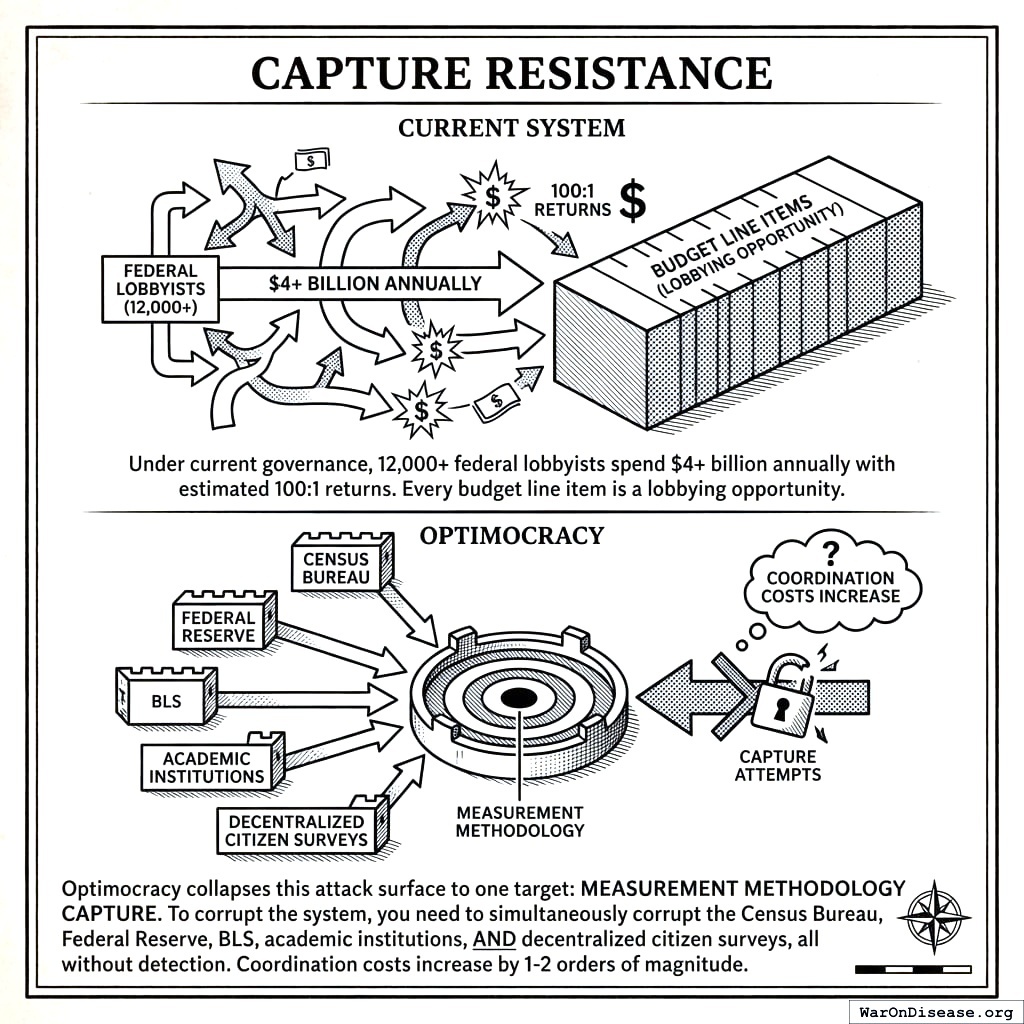
Optimocracy collapses this attack surface to one target: measurement methodology capture. To corrupt the system, you need to simultaneously corrupt the Census Bureau, Federal Reserve, BLS, academic institutions, AND decentralized citizen surveys, all without detection. Coordination costs increase by 1-2 orders of magnitude.
Time Consistency
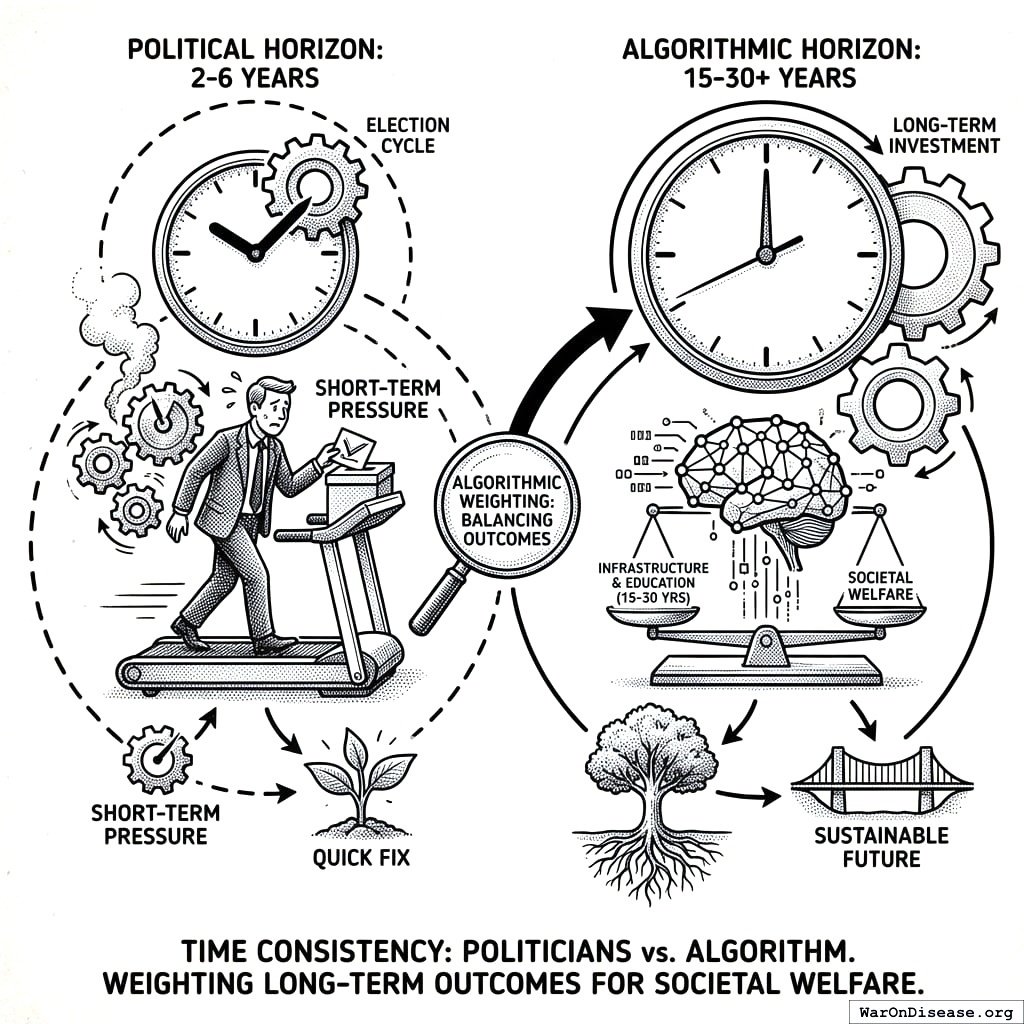
Politicians face 2-6 year horizons; welfare-improving investments often take 15-30 years to pay off. The algorithm weights long-term outcomes appropriately because it doesn’t face reelection.
Transparency
| Component | Political Governance | Optimocracy |
|---|---|---|
| Objective | Unstated | Explicit, published |
| Decision process | Closed-door negotiations | Open-source algorithm |
| Deviation detection | Requires investigative journalism | Automatic, publicly verifiable |
Any citizen can verify alignment. Politicians who ignore recommendations must do so on the record.
Depolarization
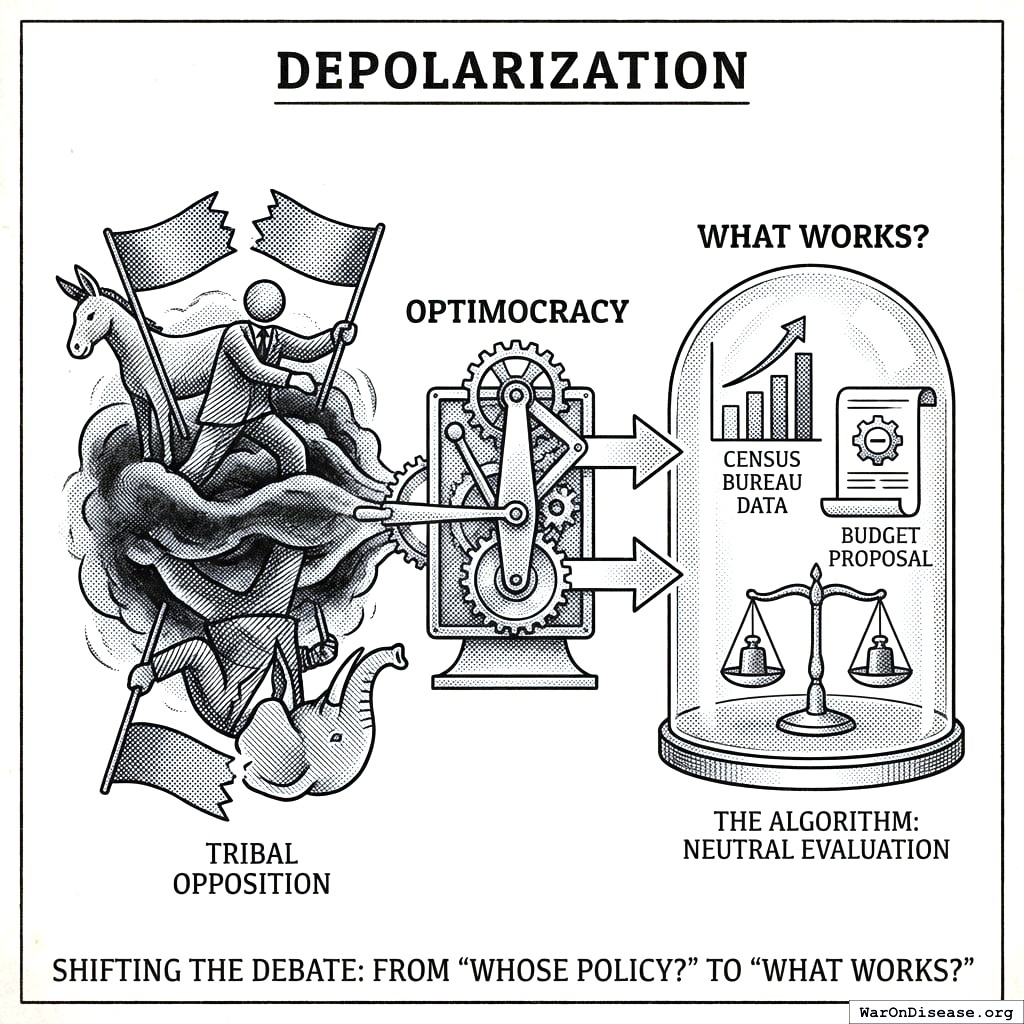
Current politics rewards tribal opposition. Optimocracy shifts the debate from “whose policy?” to “what works?” The algorithm doesn’t know which party proposed the budget. You can’t spin the Census Bureau as a Democratic or Republican institution. The number either went up or it didn’t.
Your Leader Is a Neural Network
Everything above assumes a human stays in the loop, voting on the algorithm’s recommendations. The opposite objection is fair: if the algorithm is better, why keep the human? Governance is information processing, and the human is one of the available processors. Data goes into a brain, the brain processes it, policy comes out. That is the whole job.
The current system selects the processor on traits unrelated to the job: television appearance, fundraising, tribal affiliation, name recognition, a confident speaking voice. None of these predict the quality of the policy at the far end. The species hires its information processor for everything except its ability to process information.
A biological neural network has documented defects for this particular task:
- It is lazy: it does not read the legislation it votes on.
- It is forgetful: it cannot hold the 604:1 ratio of war spending to government clinical trial spending in working memory alongside ten thousand other policy dimensions.
- It is greedy: it optimizes for reelection and personal wealth.
- It is corruptible: it has a bank account where a bribe fits.
- It is opaque: there is no inspecting why it decided anything.
- It is untestable: you cannot run a politician on simulated data to see what they would do before they do it.
- It is fragile: it runs civilization on four hours of sleep.
An artificial neural network has different defects and is stronger on every dimension that matters here. It is inspectable: you can examine the reasoning. It is testable: run it on decades of historical policy and check whether it would have chosen better than the humans did. It has no bank account, so there is nowhere to deposit the bribe. It reads every document and processes every parameter, all day, without degrading at 3am. Its defects are real, but they are a different list, and the dimensions on its list are the ones a job interview for “process information correctly” would actually test.
There is no basis for preferring carbon over silicon here except substrate. “I want my leader made of the same material as me” is not a policy argument; it is tribalism. The output is what matters. A conscious leader whose inaction kills millions is worse than an unconscious system whose optimization saves them.
The standard objections all turn out to be arguments against the current system, only worse.
“AI has no consciousness.” Leaders are not selected for consciousness; they are selected for outputs. If self-awareness produced good policy, the most introspective politicians would govern best. They do not.
“Who programs its values?” The same people who write the constitution: everyone, collectively, transparently, with amendments. The constitution already is value programming. It is currently implemented in biological networks that ignore it when ignoring it is convenient. A silicon constitution would at least be followed consistently.
“People want to feel represented.” People want clean water, cured diseases, and their children alive at the end of the year. If silicon delivers these more reliably than carbon, the preference for human representation is a luxury good, and it is paid for in lives.
“AI hallucinates.” So do politicians, and theirs become law. The difference is correctability. An AI hallucination can be detected and patched. A political hallucination becomes policy and kills people for decades before anyone checks the arithmetic. The war-to-trials ratio is a hallucination that has persisted for seventy-five years. A reviewing algorithm would have flagged it on day one.
“This is antidemocratic.” Democracy is a method for selecting the information processor. It is not the only method, and the version currently running selects for charisma. A method that selects for measurable welfare improvement, and that publishes its reasoning for anyone to inspect, is closer to the democratic spirit than an opaque process that rewards irrelevant traits.
None of this means handing the keys to a chatbot tomorrow. It means the human-in-the-loop architecture is a starting position, not a moral floor. The algorithm advises human boards; its recommendations get compared against what actually happened; a track record accumulates. If silicon demonstrably governs better across every measurable dimension, humans delegate to it the way they delegated long division to calculators: not under duress, but because the evidence stopped being arguable. The constitution becomes the value programming, amendments stay transparent and collectively approved, and no human ever again runs on four hours of sleep while deciding things that affect billions.
Challenges and Failure Modes
Why Goodhart’s Law Doesn’t Apply Here
“When a measure becomes a target, it ceases to be a good measure”151. Traditional Goodhart examples (teaching to test, hospital readmissions) involve gaming metrics without improving underlying reality.
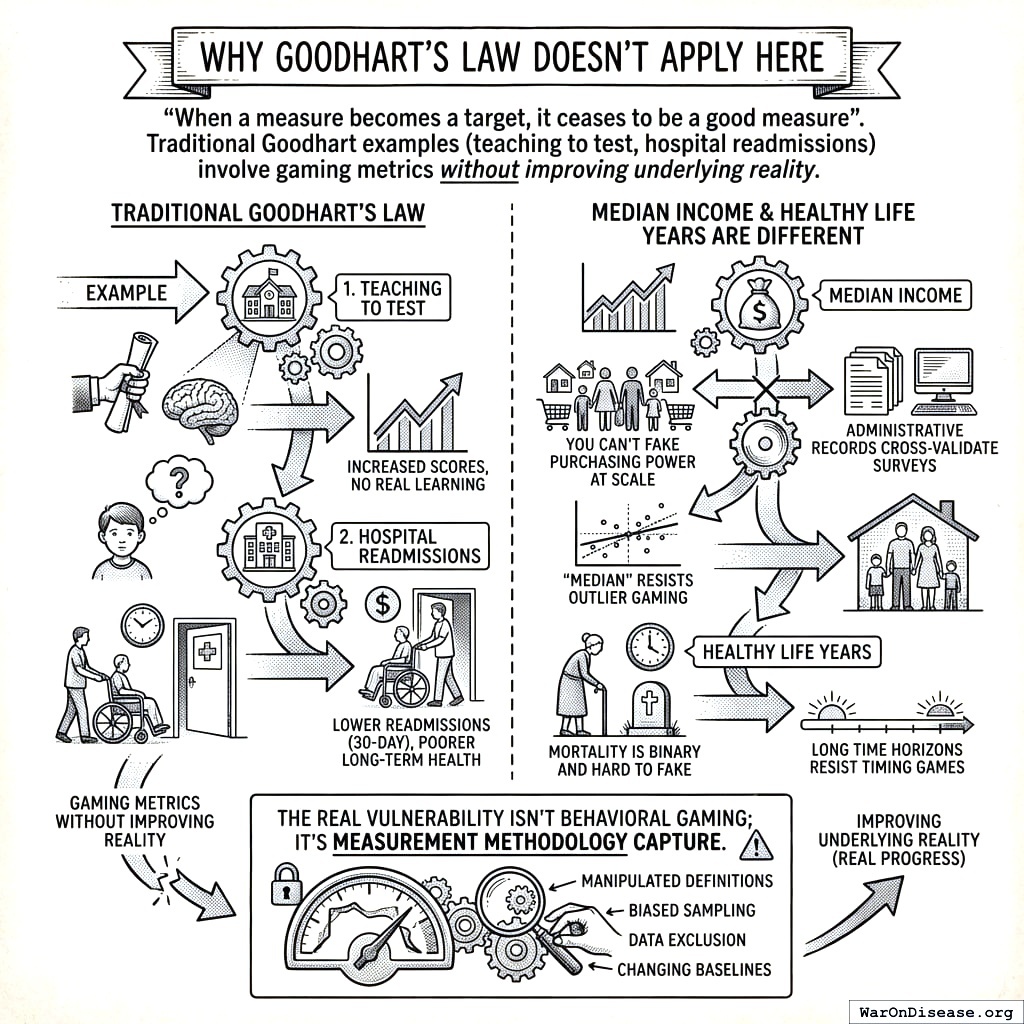
Median income and healthy life years are different: You can’t fake purchasing power at scale; administrative records cross-validate surveys. Mortality is binary and hard to fake. “Median” resists outlier gaming. Long time horizons resist timing games.
The real vulnerability isn’t behavioral gaming; it’s measurement methodology capture.
Oracle Capture (The Real Challenge)
If adversaries control the data feed, they control the allocation. This is the main attack surface.
Attack vectors: Direct manipulation, methodology capture (“redefine median household”), sample selection, timing manipulation, institutional collusion.
Government statistics are not neutral: Unemployment definitions (U3 vs U6) differ by 50%+. CPI methodology has changed 20+ times since 1978. With trillions at stake, the incentive to influence measurement is enormous.
Defense-in-depth:
| Defense Layer | Why It Helps |
|---|---|
| Multiple independent sources (5+) | Capturing five agencies with different governance is much harder than one |
| Decentralized citizen surveys | Ground truth that exposes manipulation in official statistics |
| International benchmarking | Makes domestic manipulation visible via OECD/UN comparison |
| Academic replication | Adversarial verification with reputation incentives |
The honest assessment: Oracle capture is not a solvable technical problem. The question is whether oracle capture is less damaging than current allocation capture. The answer may be yes: oracle capture affects measurement, while allocation capture affects outcomes directly. The wrapper architecture converts oracle capture from catastrophic failure to degraded performance, as politicians can ignore manipulated data.
Democratic Legitimacy
The concern: “The algorithm decided” lacks the felt legitimacy of “we the people decided.”
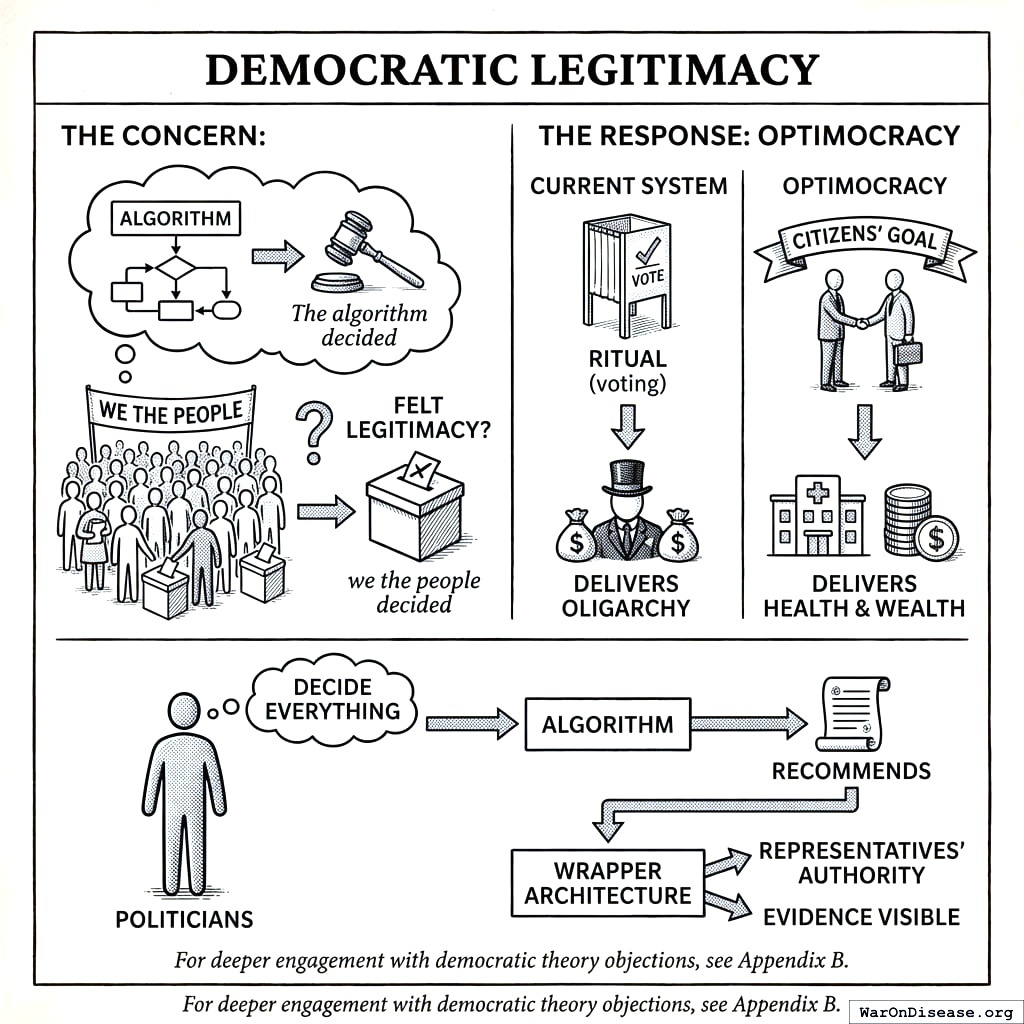
The response: Optimocracy is more democratic, not less. The current system offers ritual (voting) but delivers oligarchy (136). Optimocracy delivers what citizens actually voted for: health and wealth.
Politicians still decide everything. The algorithm only recommends. Citizens choose the goal; we already delegate implementation to the Fed and FDA. The wrapper architecture preserves representatives’ authority completely while making their alignment with evidence visible.
For deeper engagement with democratic theory objections, see Appendix B.
Testable Predictions
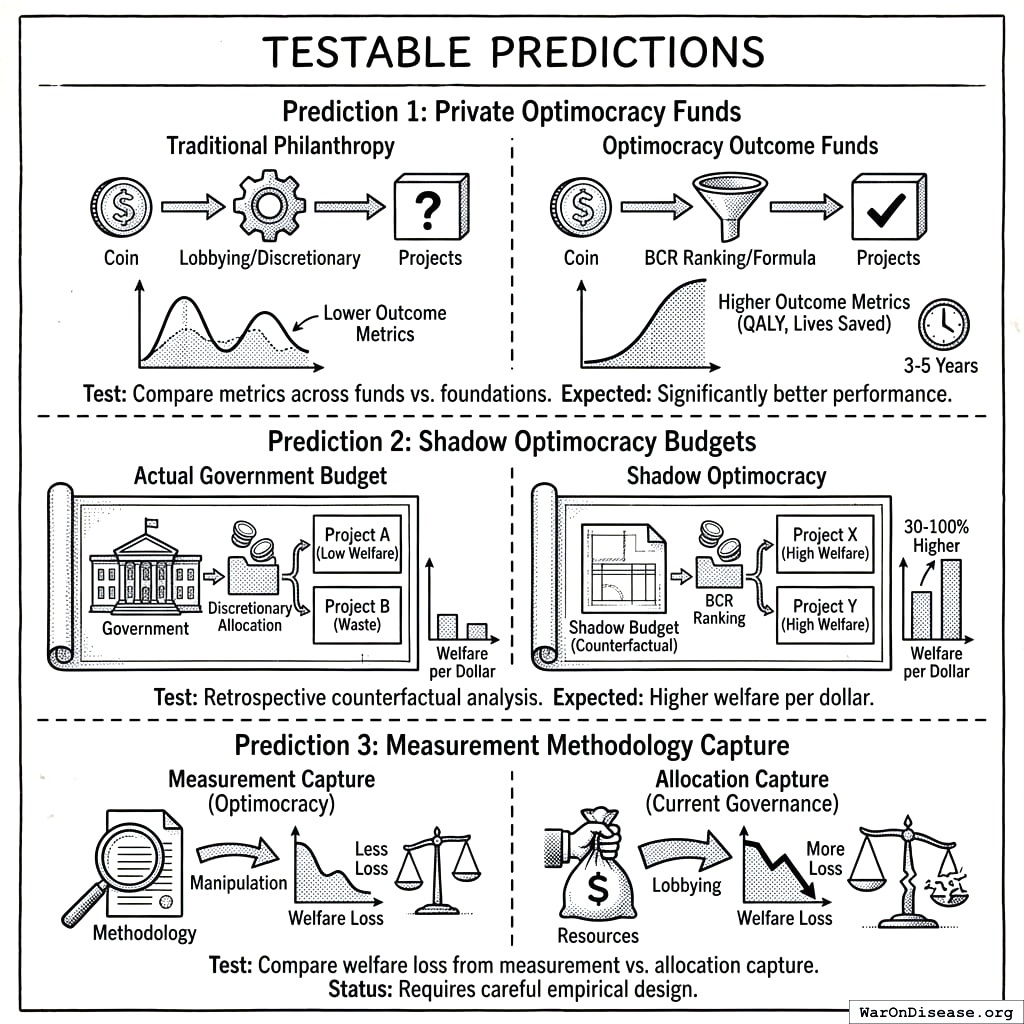
A publishable theory must generate falsifiable predictions. This section presents predictions that would confirm or refute the Optimocracy thesis. (Note: Existing evidence already supports the general case for algorithmic over discretionary allocation; formula programs like Social Security show lower lobbying intensity than discretionary programs150. The predictions below are specific to Optimocracy.)
Prediction 1: Private Optimocracy funds will outperform traditional philanthropic allocation on chosen metrics.
- Test: Compare QALY/\(, lives saved/\), or similar metrics across Optimocracy outcome funds vs. traditional foundations
- Expected finding: Optimocracy allocation achieves significantly better metric performance (commensurate with eliminating the Crony Tax)
- Timeline: Testable within 3-5 years of deployment
Prediction 2: Shadow Optimocracy budgets will outperform actual government budgets in retrospective analysis.
- Test: Construct counterfactual “what if government allocated according to BCR rankings” and compare projected outcomes
- Expected finding: Shadow budget shows 30-100% higher welfare per dollar
- Timeline: Testable immediately with existing data
Prediction 3: Measurement methodology capture under Optimocracy will be less welfare-reducing than allocation capture under current governance.
- Test: Compare welfare loss from documented measurement manipulation vs. documented lobbying/capture
- Expected finding: Measurement capture is harder and less damaging than allocation capture
- Status: Requires careful empirical design
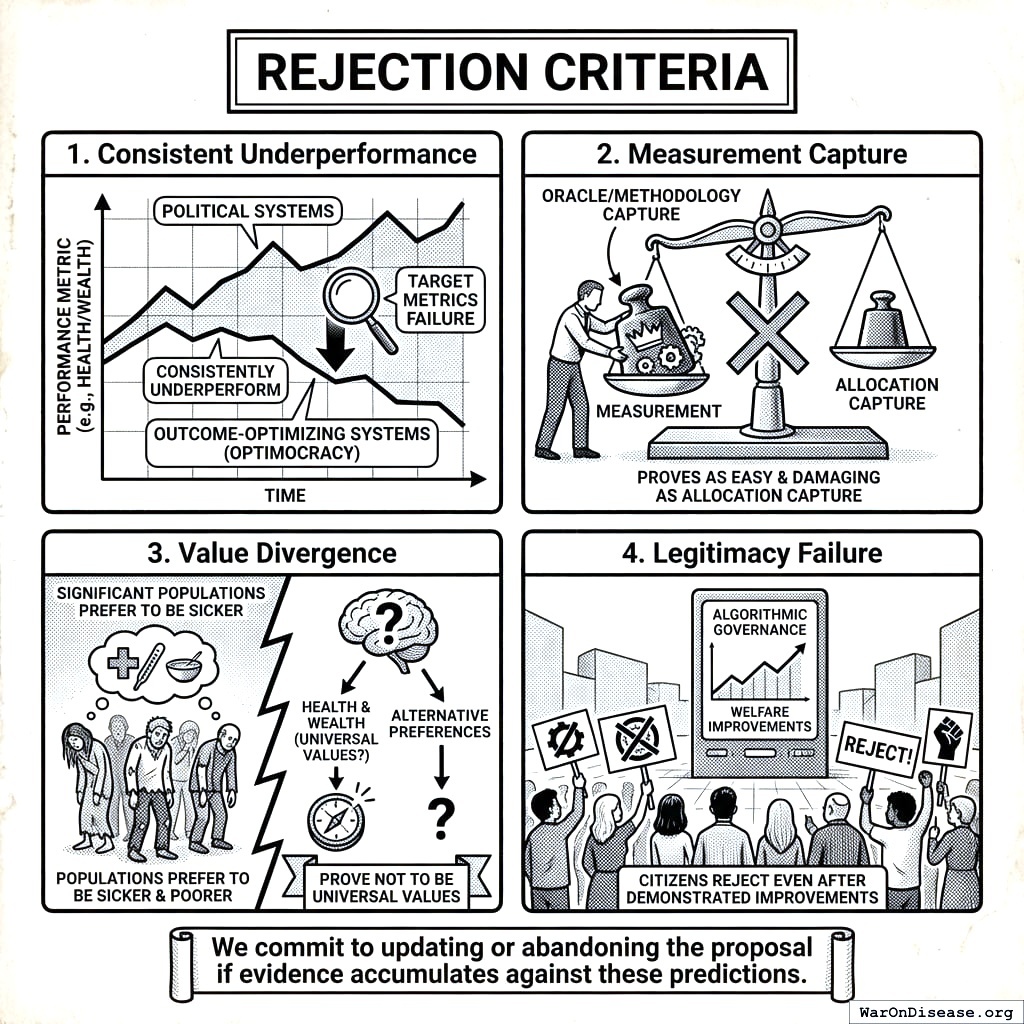
Rejection Criteria
The Optimocracy thesis would be falsified by:
- Consistent underperformance: If outcome-optimizing systems consistently underperform political systems on their target metrics
- Measurement capture: If oracle/methodology capture proves as easy and damaging as current allocation capture
- Value divergence: If health and wealth prove NOT to be universal values (if significant populations genuinely prefer to be sicker and poorer)
- Legitimacy failure: If citizens reject algorithmic governance even after demonstrated welfare improvements
We commit to updating or abandoning the proposal if evidence accumulates against these predictions.
The Wrapper Architecture: How Funding Works
Optimocracy provides the what (evidence-based recommendations); the SuperPAC provides the how (making alignment profitable). The integration works as follows:
| Event | What Happens |
|---|---|
| Optimocracy publishes recommendations | “Support HR-1234 (early childhood funding increase).” “Oppose HR-5678 (regulatory capture provision).” |
| Votes recorded | Senator Smith votes aligned on both (2/2 = 100%). Senator Jones votes misaligned on both (0/2 = 0%). |
| Alignment scores calculated | End-of-quarter totals: Smith 78% aligned with recommendations. Jones 34% aligned. |
| SuperPAC allocates support | Algorithm weighs: alignment difference between candidates, position power, race competitiveness, marginal funding impact. Smith’s competitive race with high alignment gets priority. |
| Public transparency | Citizens see: “Smith followed evidence-based recommendations 78% of the time.” |
| System validation (ongoing) | Over years, metrics trend upward. This validates the recommendations, attracting more donations. |
Funding sources. These capitalize the independent-expenditure route specifically, which is one of four adoption mechanisms and not the cheapest. Institutional adoption and shareholder pressure require no campaign war chest at all.
Donations (primary): A dollar of donations shifts far more than a dollar. Historical lobbying ROI suggests $1 of campaign spending can shift $100+ in policy outcomes. This makes funding Optimocracy more effective than traditional charity.
Incentive Alignment Bonds152 (for specific reallocations): When Optimocracy recommends a specific funding reallocation (like the 1% Treaty153 154), IABs can provide investor returns tied to policy success. Investors get a percentage of redirected funds, scaling funding beyond donations.
Campaign Funding Allocation Algorithm
The SuperPAC maximizes expected governance improvement per dollar. For each race, calculate:
\[ E[\Delta G] = \text{alignment\_gap} \times \text{position\_power} \times \text{win\_probability\_shift} \times P(\text{marginal\_dollar\_matters}) \]
Factors:
| Factor | What it measures | Example |
|---|---|---|
| Alignment gap | |candidate_A_score - candidate_B_score| | 78% vs 34% = 44-point gap |
| Position power | Committee chairs, leadership, swing votes | Health Committee chair = 3× multiplier |
| Race competitiveness | How much can funding shift the outcome? | 48-52 polling = high; 30-70 = zero |
| Marginal funding effectiveness | Diminishing returns as spending increases | First $1M matters more than 10th $1M |
Allocation priority examples:
| Race | Alignment Gap | Competitiveness | Position Power | Priority |
|---|---|---|---|---|
| Senate (Health Cmte chair) | 40 pts | Close (48-52) | High | Top |
| Senate (backbencher) | 40 pts | Close (48-52) | Medium | High |
| House (swing district) | 30 pts | Close (49-51) | Low | Medium |
| Senate (safe seat) | 50 pts | Landslide (70-30) | High | Low (can’t shift outcome) |
| House (safe seat) | 10 pts | Safe (60-40) | Low | Skip |
A close race with a large alignment gap gets priority over a safe seat, even if the safe-seat candidate has higher absolute alignment. Funding flows where it can actually change outcomes.
Dynamic reallocation: As polling shifts during election season, the algorithm reallocates. A race that becomes uncompetitive frees funds for newly competitive races.
Political Economy: Making Reform Happen
The empirical case for Optimocracy is strong (Section 2 documented $4.98 trillion (95% CI: $4.39 trillion-$5.61 trillion) in US waste and $101 trillion (95% CI: $59.6 trillion-$161 trillion) in global opportunity costs). But optimal policy has been documented for decades. The question is not “what should we do?” but “how do we overcome political opposition to doing it?”
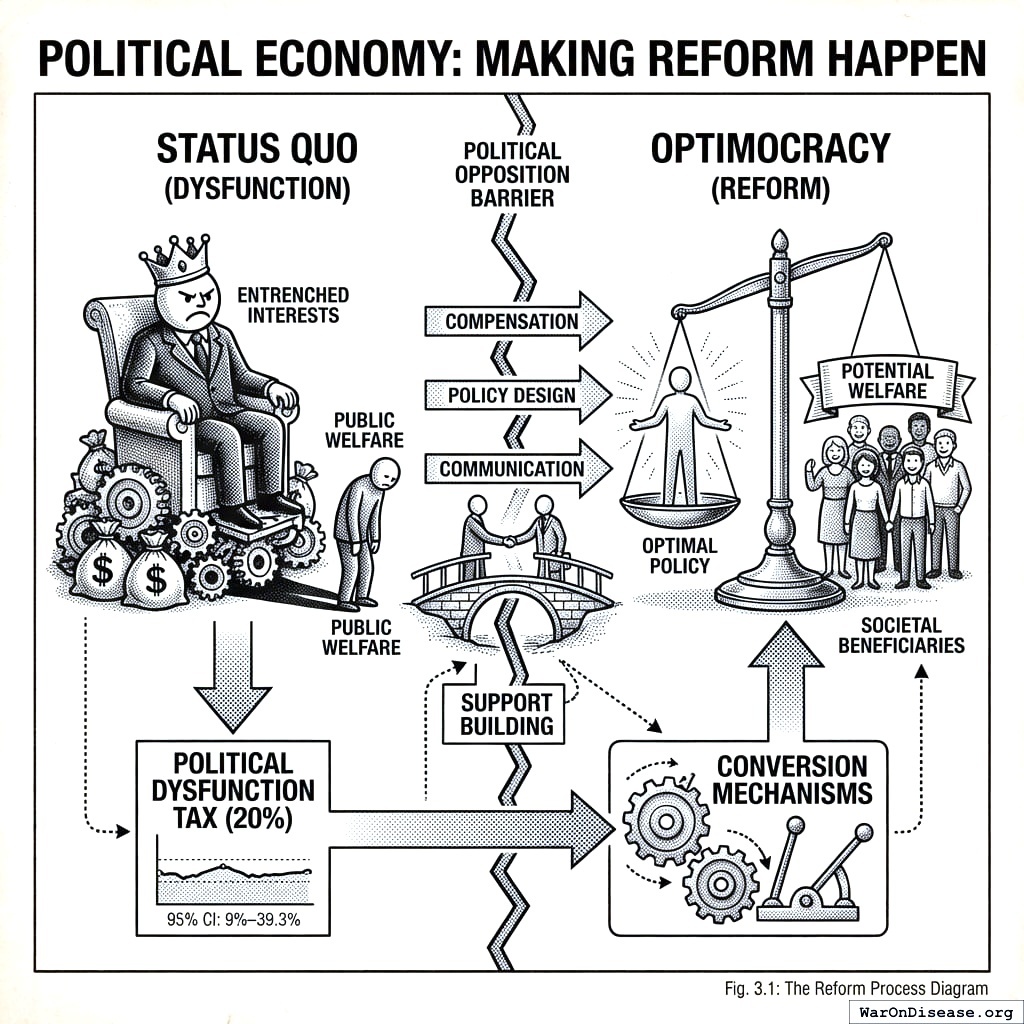
This section develops the political economy of reform, distinguishing actors who benefit from optimal policy from those who lose, and proposing mechanisms to convert opponents into supporters.
Four Mechanisms, Ranked by Cost
The scoreboard has no teeth on its own. Four mechanisms could give it some. They are not alternatives to each other in the sense that only one can be chosen; they differ in cost, in speed, and in what happens when they fail, and the cheapest ones should be exhausted first.
1. Direct institutional adoption. An agency, a foundation, a sovereign wealth fund, or a large philanthropy uses the recommendations because they are correct. This costs nothing beyond producing the analysis, requires no political entity, and is how cost-effectiveness research already moves money at GiveWell and Open Philanthropy. It is slow and it is bounded by the budgets of institutions that already wanted to be evidence-driven. The GiveWell Outcome Fund deployment below is this mechanism. Try it first, because it is free.
2. Corporate lobbying redirection. The organizations that spend $4.4 billion (95% CI: $3.74 billion-$5.06 billion) per year lobbying the US federal government150 are, with few exceptions, publicly traded. Their shares carry votes. Their boards direct their lobbying budgets. A shareholder who can demonstrate that a company’s lobbying produces negative returns for that company’s own shareholders is making a fiduciary argument, not a political one, and fiduciary arguments are the kind that institutional investors are obligated to evaluate. Engine No. 1 won three ExxonMobil board seats in 2021 holding 0.02% of the shares, because the three largest index-fund managers found the economic case persuasive. Military contractors alone direct $198 million (95% CI: $190 million-$210 million) per year25. This mechanism buys the apparatus rather than renting its output, so the expenditure is an asset that persists rather than a campaign cost that recurs. It is also slower than writing a check and it is subject to proxy rules, disclosure thresholds, and the possibility that the board simply wins the vote.
3. Independent expenditure (the SuperPAC). Fund the campaigns of legislators who score well. This is the fastest mechanism and the most legible, and it is developed in detail below. It is also rent: the money is spent, the alignment lasts one cycle, and a better-funded opponent can outbid it at the next election. Its cost scales with the number of races, not with the quality of the analysis.
4. Revenue-share instruments. Where a recommendation redirects a specific, measurable funding stream, a security can pay investors a defined share of that stream conditional on the redirection occurring, which converts passive supporters into a lobby with a contractual interest in the policy surviving. Incentive Alignment Bonds152 are the worked example, and the 1% Treaty153 is the case where the stream is defined enough to securitize. This mechanism is the only one of the four that survives after the vote is won, because the payment obligation continues and its holders have standing to enforce it. It is also the most legally intricate, it requires a redirected stream to exist before there is anything to share, and it consumes a fraction of the redirected money permanently. Reach for it when a recommendation is large, specific, and durable enough to justify the complexity, and not before.
The general rule: mechanisms 1 and 2 acquire durable capacity, 3 rents temporary capacity, and 4 buys durability at the price of a permanent revenue slice. A recommendation that can be adopted through mechanism 1 should never be funded through mechanism 4.
Why Buying Off the Opposition Works
Optimal policy creates massive value ($20-50T annually). Those currently benefiting from bad policy would lose much less ($2-5T annually).
The math: Pay off all the losers and you still have $15-45T left over. This is why reform is feasible: the pie is big enough that everyone can get a bigger slice.
(This is the Coase Theorem155 applied to governance: when gains vastly exceed losses, compensation makes everyone better off.)
How the SuperPAC Makes This Concrete
The Optimocracy SuperPAC creates a market for political support. It allocates campaign support proportional to politician alignment with evidence-based recommendations. Alignment is tracked via Optimocracy’s recommendation/voting comparison. Politicians can follow donor preferences or follow evidence and receive SuperPAC support. The scoring rules are transparent and published.
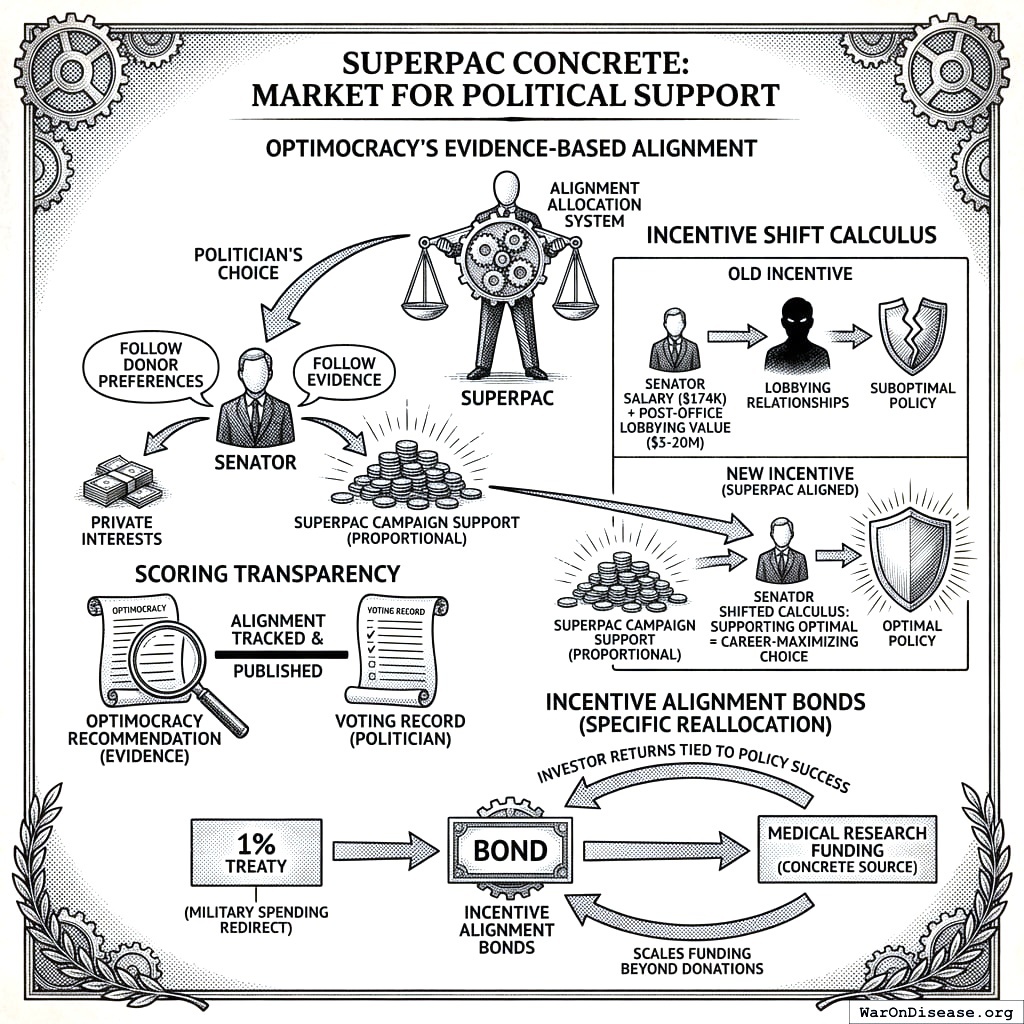
A senator currently receives ~$174K salary plus ~$5-20M in career post-office value from lobbying relationships. SuperPAC campaign support for aligned politicians shifts this calculus: supporting optimal policy becomes the career-maximizing choice.
For specific policy reallocations with concrete funding sources (like the 1% Treaty redirecting military spending to medical research), Incentive Alignment Bonds can scale funding beyond donations by providing investor returns tied to policy success.
The Cost of Political Reform
Political feasibility is a cost, not a binary. In a companion analysis (see How Much Does It Cost to Buy All the Governments?156), we estimate the maximum plausible cost of achieving political reform through democratic engagement.
US Political System Reform Investment (Maximum Scenarios):
| Component | Cost Estimate |
|---|---|
| Match all lobbying expenditure (1.5×) | $6.6B/year |
| Match all federal campaign spending | $10B/cycle |
| Match full Congress career incentives (535 × ~$10M NPV)1 | $5.35B one-time |
| Total US maximum reform investment | ~$25B |
For reforms like the 1% Treaty ($2.5T NPV conservative estimate), this implies ~100:1 ROI. Political reform is dramatically underinvested relative to its expected value.
The Natural Reform Coalition
The political economy of reform requires identifying actors who would benefit from optimal policy and mobilizing them to overcome opposition.
Major Health Funders as Anchor Investors
The most natural funders for political reform are organizations already committed to maximizing health outcomes:
| Funder | Annual Health Spending | Current Focus | Reform Alignment |
|---|---|---|---|
| Gates Foundation | ~$7B | Global health, disease eradication | High: political reform unlocks orders of magnitude more impact |
| Wellcome Trust | ~$1.5B | Biomedical research | High: regulatory reform accelerates drug development |
| Open Philanthropy | ~$500M | GiveWell-style interventions, policy reform | Very high: already funds policy advocacy |
| Bloomberg Philanthropies | ~$1.5B | Public health, tobacco/obesity | High: policy is their primary lever |
| Arnold Ventures | ~$500M | Evidence-based policy | Very high: explicitly focused on policy effectiveness |
These funders collectively spend $10B+ annually on health. If even 5% were redirected to political reform infrastructure (the Optimocracy SuperPAC), it would exceed all current political reform spending.
The ROI Case for Funders
The Gates Foundation achieves approximately $50-100 per DALY through direct interventions. A $25B investment in political reform, even at 5% success probability, yields expected cost-effectiveness of ~$0.025 per DALY, roughly 3,000x more cost-effective. This calculation is developed in detail in How Much Does It Cost to Buy All the Governments?: Implications for Major Health Funders.
Why Funders Haven’t Invested (Yet)
Three barriers explain underinvestment in political reform:
Legibility: Direct interventions have clear attribution (“we funded 10M bed nets”). Political reform success is diffuse and contested.
Reputational risk: Political engagement risks partisan association. Optimocracy’s outcome focus (health and wealth, not ideology) mitigates this.
Coordination failure: No single funder can reform the political system. The SuperPAC provides the coordination mechanism: funders contribute to a pool that rewards outcome-aligned politicians.
Coalition Structure
The reform coalition assembles in phases:
| Phase | Actors | Role | Capital |
|---|---|---|---|
| Seed | Reform advocates, EA orgs | Initial design, proof of concept, first institutional adopter | $10-50M |
| Pilot | Tech billionaires, forward-looking foundations | First activist positions and first SuperPAC deployment | $100M-500M |
| Scale | Major health funders | Anchor capital across mechanisms; revenue-share instruments where a stream is defined | $1-5B |
| Victory | Converted politicians, broader coalition | Political implementation | $10-25B |
Reform advocates provide initial capital and legitimacy; major funders provide anchor capital for the SuperPAC; converted politicians provide political support. The arithmetic strongly favors reform: welfare gains ($20-50T annually) vastly exceed maximum compensation costs ($25-200B one-time).
Implementation Pathway
Why Government Adoption Isn’t Required
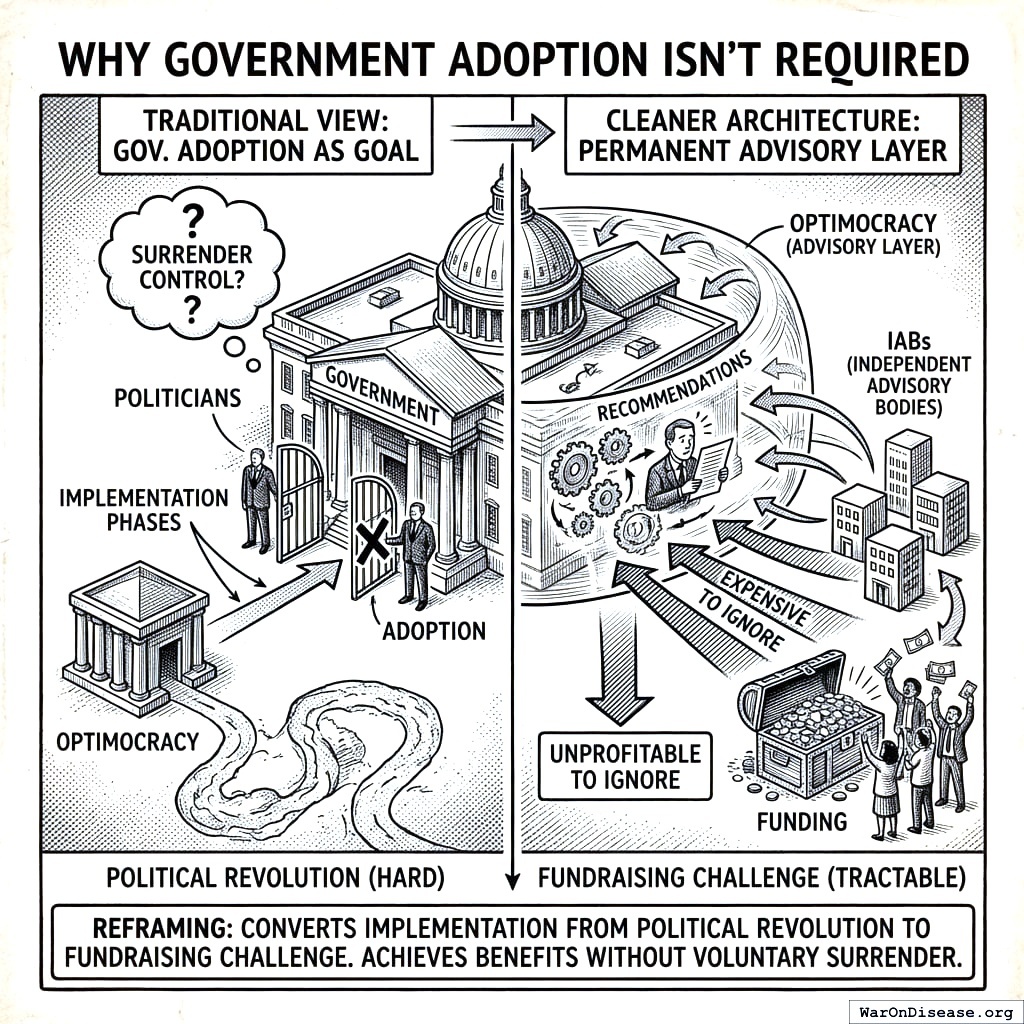
Optimocracy operates as a permanent advisory layer. Nothing in the analytical engine requires anyone’s consent: the policy data is public, the roll-call votes are public, and publishing the comparison is speech. Politicians surrender nothing by being measured, which is precisely why no one has to approve it first.
What adoption requires depends on which mechanism is used, and the first two require no legislature and no campaign apparatus. An institution can act on the recommendations tomorrow because they are correct, and a shareholder can raise a company’s lobbying ROI at its next annual meeting. This converts implementation from a political revolution into a sequence of ordinary private decisions, which is a much duller problem and therefore a far more tractable one.
Implementation Strategy
Optimocracy does not require government permission for private fund allocation. The technology exists today. The strategy: start private → demonstrate → scale.
- Private Outcome Fund: Deploy $10M+ for philanthropic capital, prove mechanism works
- Shadow Tracking: Generate counterfactual “what would Optimocracy allocate?” to demonstrate outperformance
- Government Pilots: Partner with reform-minded jurisdictions for limited-scope pilots
- Broader Adoption: Scale through demonstrated success and competitive pressure
The bottleneck is not technology. The bottleneck is coordination: assembling capital, coalition members, and governance structures. Starting small is a feature: a $10M outcome fund with 50 committed participants can experiment, fail fast, and improve before scaling.
Concrete First Deployment: The GiveWell Outcome Fund
We propose a specific first deployment to make Optimocracy actionable rather than theoretical.
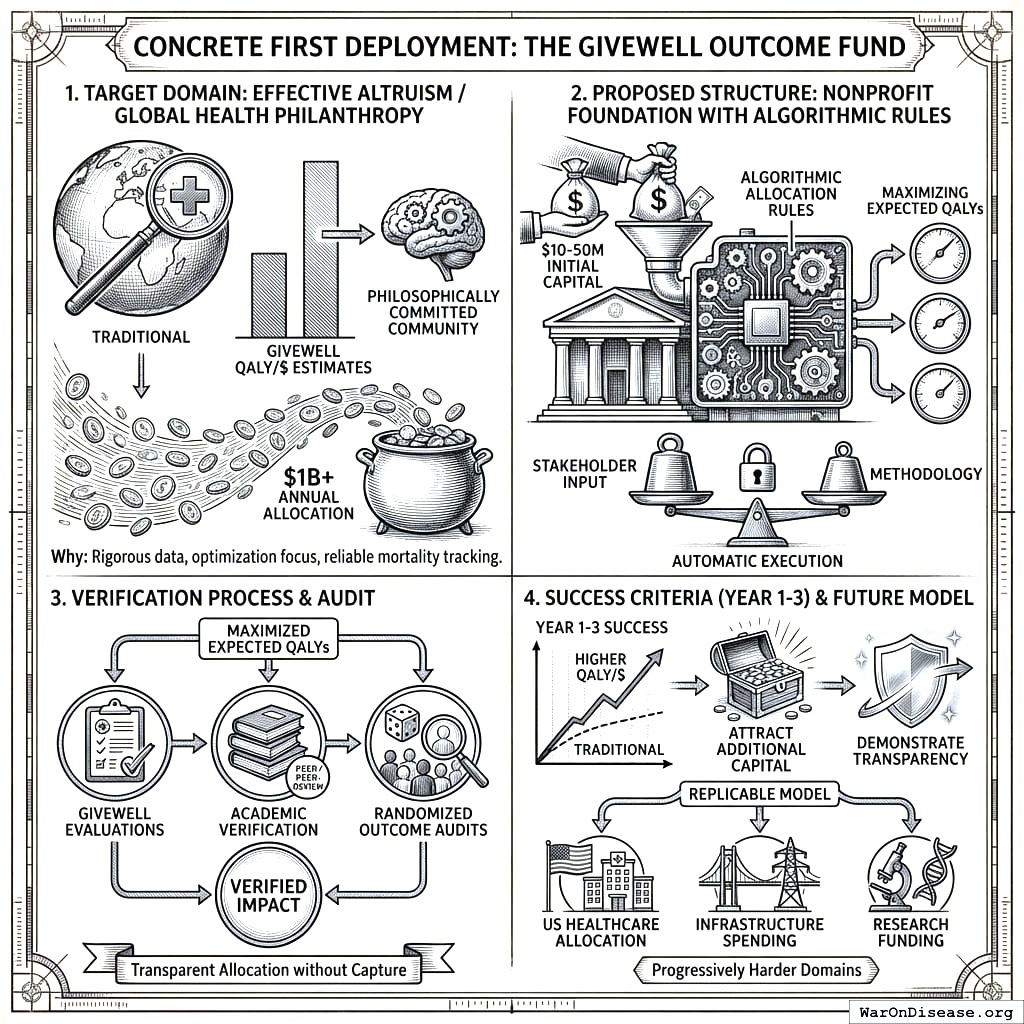
Target domain: Effective altruism / global health philanthropy. Why: GiveWell already produces rigorous QALY/$ estimates, the EA community is philosophically committed to outcome optimization, mortality data is increasingly reliable, and the community allocates $1B+ annually.
Proposed structure: Nonprofit foundation with algorithmic allocation rules, $10-50M initial capital from aligned foundations, maximizing expected QALYs verified by GiveWell evaluations + academic verification + randomized outcome audits. Public input on methodology; algorithm execution is automatic.
Success criteria (Year 1-3): Achieve measurably higher QALY/$ than comparable traditional foundations, demonstrate transparent allocation without capture, attract additional capital, and generate replicable model for progressively harder domains (US healthcare allocation, infrastructure spending, research funding).
Conclusion
Political governance is not failing because politicians are evil or voters are ignorant. It is failing because the incentive structure makes capture inevitable. No amount of transparency, campaign finance reform, or civic education can eliminate the fundamental misalignment between political incentives and citizen welfare.
Optimocracy offers a different approach: rather than relying on systems that don’t optimize for outcomes, introduce outcome-optimizing allocation for decisions where optimization is feasible. Define the objective democratically, measure outcomes rigorously, allocate algorithmically, and enforce via transparent rules.
The precedents are encouraging. Formula-based programs like Social Security COLA remove annual political battles. Published, transparent allocation rules enable credible commitment by making deviation visible.
Optimocracy is not utopian. It faces real challenges: measurement methodology capture, edge cases, and democratic legitimacy. But these challenges are addressable through institutional diversity, the wrapper architecture, and iterative implementation.
The question is not whether Optimocracy is perfect; no governance system is. The question is whether outcome-optimizing algorithmic allocation produces better outcomes than captured allocation. The evidence suggests it does.
What About AI?
Some may ask: won’t superintelligent AI make Optimocracy obsolete? The answer is no. Optimocracy is the safe architecture for AI governance. “Aligned AI” requires specifying aligned to what. Health and wealth are the answer: universal human values, not arbitrary choices. Even a superintelligent AI should operate within an Optimocracy-like structure: optimize for what humans universally value, independent systems verify outcomes, and humans retain final approval authority. The algorithm (whether simple optimization or AGI) proposes; humans decide. Optimocracy isn’t replaced by better AI; it’s what makes AI governance safe. The framework scales from spreadsheet calculations to superintelligence while preserving human oversight.
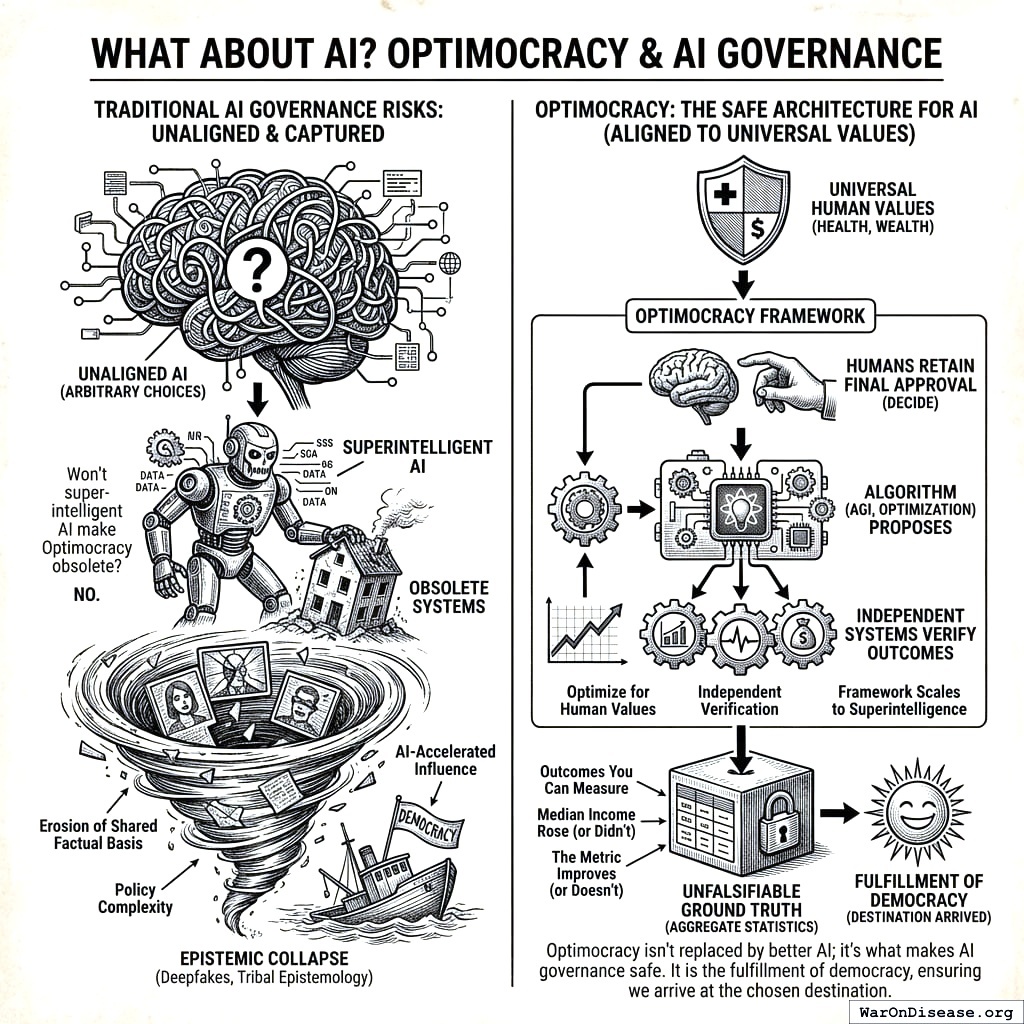
We propose Optimocracy not as a replacement for democracy but as its fulfillment: a system where citizens genuinely choose outcomes, not just representatives who promise outcomes and deliver something else. Democracy selects the destination; Optimocracy ensures we actually arrive.
The urgency grows with each passing year. Deepfakes are eroding the shared factual basis democracy requires. Policy complexity increasingly exceeds human cognitive capacity. AI-accelerated influence operations will make capture orders of magnitude cheaper and more effective. The tribal epistemology that already interprets identical videos along partisan lines will have no ground truth whatsoever once synthetic media becomes indistinguishable from authentic footage. Optimocracy offers an exit from this epistemic collapse: outcomes you can measure, not narratives you must trust. Aggregate statistics from multiple independent sources provide unfalsifiable ground truth. Median income either rose or it didn’t. The metric either improves or it doesn’t. That fact provides a foundation for governance when all other foundations have eroded.
Appendix A: Technical Specification Sketch
Budget and Policy Optimization: Two Complementary Frameworks
Optimocracy optimizes governance through two complementary mechanisms, each addressing a different aspect of the welfare-maximization problem.
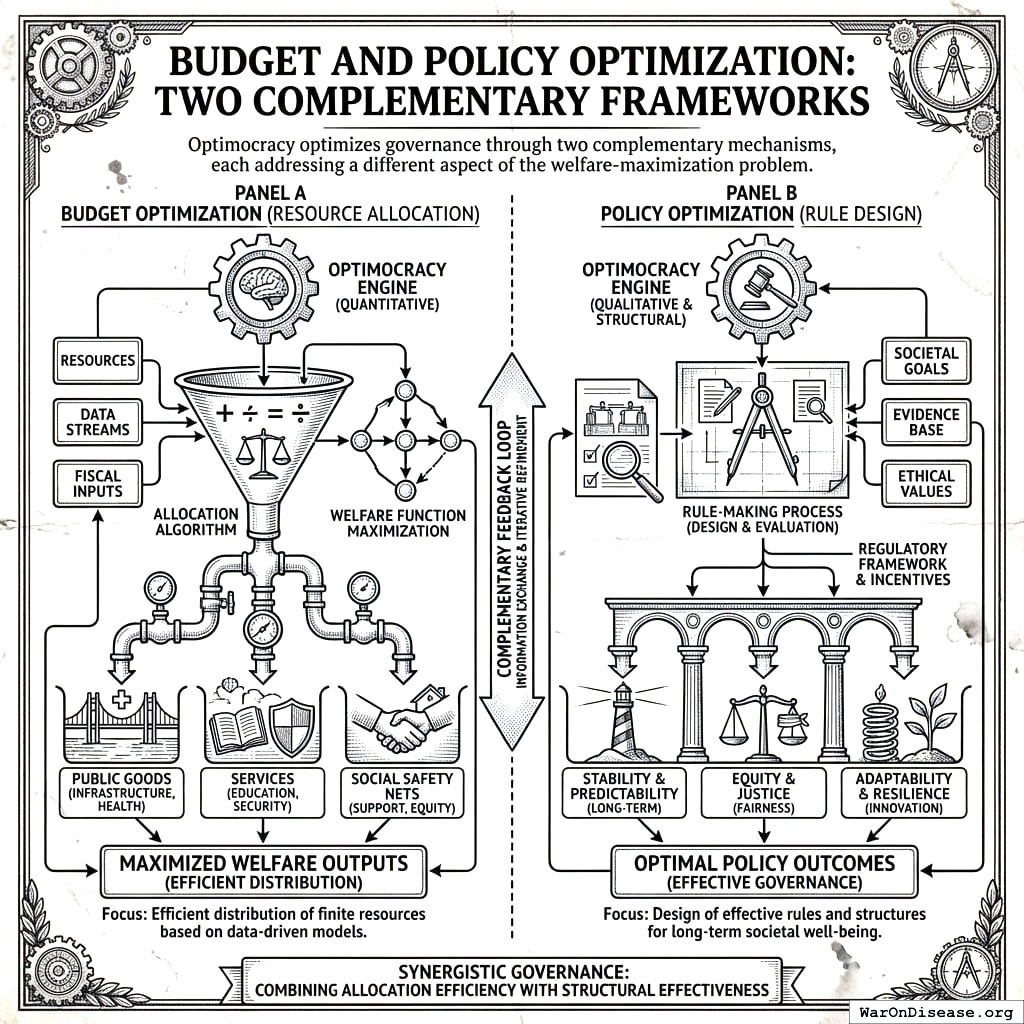
Budget Optimization: The Optimal Budget Generator (OBG) Framework
The Optimal Budget Generator (OBG) framework answers: “How should we allocate the budget to maximize welfare?”
Each spending category has an optimal level - not just a marginal return. Too little means underinvestment and foregone welfare gains; too much means diminishing returns. But unlike the Recommended Daily Allowance for nutrients (where you can meet all targets simultaneously), budget allocation is zero-sum: spending more on one category means less for others. OBG generates integrated recommendations that balance these tradeoffs.
| Spending Level | Health Analogy | Budget Interpretation |
|---|---|---|
| Below optimal | Vitamin deficiency | Foregone welfare gains |
| At optimal | Recommended daily allowance | Maximum return per dollar |
| Above optimal | Diminishing returns / toxicity | Waste, opportunity cost |
The OBG framework combines three evidence sources:
- Reference country benchmarking: What do high-performing peer countries spend?
- Diminishing returns modeling: Where is the “knee” of the spending-outcome curve?
- Cost-effectiveness threshold analysis: Which interventions pass standard health economics thresholds?
The Budget Impact Score (BIS) measures our confidence in each category’s target estimate based on the quality of causal evidence. Categories with strong RCT evidence have high BIS; categories with only cross-sectional correlations have low BIS.
Example output:
| Category | Current | Target | Gap | Evidence |
|---|---|---|---|---|
| Pragmatic clinical trials | $0.5B | $50B | +$49.5B | A (RCTs) |
| Vaccinations | $8B | $35B | +$27B | A (RCTs) |
| Basic research | $45B | $90B | +$45B | B (spillovers) |
| Military | $850B | $459B | -$391B | C (benchmarks) |
For the complete methodology including estimation procedures, validation framework, and worked examples, see Optimal Budget Generator Specification.
Policy Optimization: The Policy Impact Score (PIS) Framework
The Policy Impact Score (PIS) framework answers: “Which policy reforms would most improve welfare outcomes?”
This extends beyond budget allocation to evaluate all policies: laws, regulations, taxes, and administrative rules. Budget reallocation alone cannot fix structural inefficiencies:
| Problem Type | Example | Budget Optimization Handles? |
|---|---|---|
| Program allocation | Too little preventive care | Yes (reallocate budget) |
| Administrative overhead | ~$1T/year US admin costs | No (requires regulatory reform) |
| Drug pricing | US pays 256% of OECD average158 | No (requires policy change) |
PIS uses quasi-experimental methods (synthetic control, difference-in-differences, regression discontinuity) to estimate causal effects of policy changes across centuries of variation in hundreds of jurisdictions.
Example output:
| Policy Reform | Effect on Outcome | Evidence Grade |
|---|---|---|
| Tobacco tax (+$1/pack) | -8.2 pp smoking rate | A (synthetic control) |
| Seat belt laws (primary) | -1.8 traffic deaths/100K | A (DiD, 47 states) |
| Occupational licensing | +2-3% consumer prices | B (cross-state variation) |
For the complete methodology including database schema, Bradford Hill criteria mapping, and validation framework, see Optimal Policy Generator Specification.
How They Work Together
| Framework | Unit of Analysis | Primary Output | Key Question |
|---|---|---|---|
| OBG/BIS | Spending category | Integrated budget recommendations | How much to spend? |
| PIS | Policy/regulation | Ranked reforms by impact | Which policies to adopt? |
Both frameworks generate recommendations that politicians can follow or ignore:
+------------------------+    +------------------------+
|   Budget Optimization  |    |   Policy Optimization  |
|   (OBG/BIS Framework)  |    |   (PIS Framework)      |
|                        |    |                        |
|   Recommends:          |    |   Recommends:          |
|   - Optimal spending   |    |   - Which reforms      |
|     levels per category|    |     improve welfare    |
|   - Investment gaps    |    |   - Priority ranking   |
+------------------------+    +------------------------+
           |                              |
           +------------+  +--------------+
                        |  |
                        v  v
         +---------------------------+
         |   ORACLE VERIFICATION     |
         |   Independent measurement |
         |   of actual outcomes      |
         +---------------------------+
The Political Dysfunction Tax ($4.98 trillion (95% CI: $4.39 trillion-$5.61 trillion) in US waste, $101 trillion (95% CI: $59.6 trillion-$161 trillion) in global opportunity costs) arises from both misallocation (wrong spending levels) and bad policy (welfare-reducing regulations). Addressing both requires both frameworks working together.
Algorithmic Governance Threat Model
Any honest assessment of algorithmic governance must acknowledge potential failure modes and attack surfaces:
Known Failure Modes
| Attack Vector | Risk | Mitigation | Residual Risk |
|---|---|---|---|
| Verification manipulation | Corrupting data feeds to trigger favorable allocations | Multi-source aggregation, time-weighted averages, circuit breakers | High: fundamental challenge |
| Parameter exploitation | Gaming system rules through edge cases | Formal verification, economic audits | Medium: novel attacks possible |
| Administrative compromise | Capturing upgrade or amendment authority | Multi-party approval, time-locks, transparency requirements | Medium: key management remains hard |
| Implementation errors | Software bugs leading to unintended behavior | Code audits, gradual deployment, bug bounties | Medium: novel variants emerge |
Realistic Security Properties
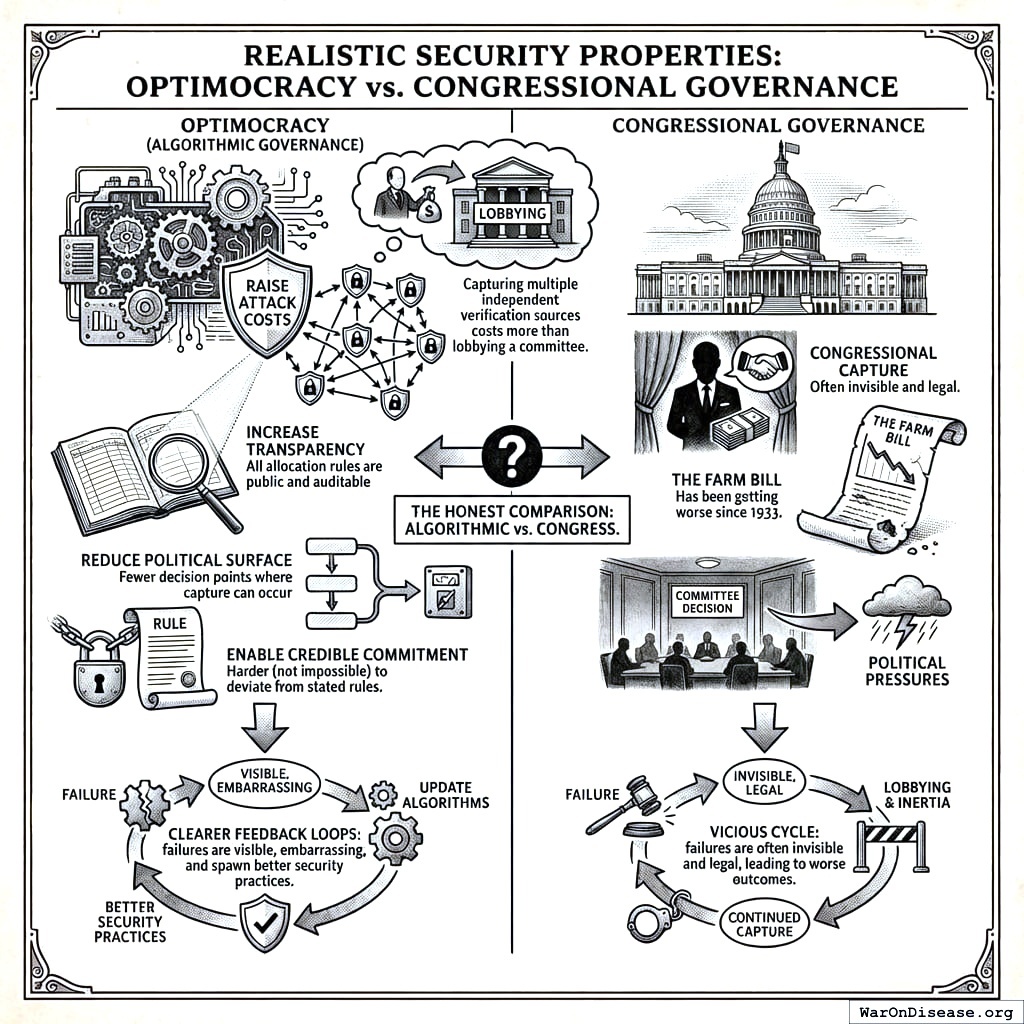
Optimocracy does not claim to eliminate all governance risk. It claims to:
- Raise attack costs: Capturing multiple independent verification sources costs more than lobbying a committee
- Increase transparency: All allocation rules are public and auditable
- Reduce political surface: Fewer decision points where capture can occur
- Enable credible commitment: Harder (not impossible) to deviate from stated rules
The honest comparison isn’t “algorithmic governance vs. perfect security.” It’s “algorithmic governance vs. Congress.” Algorithmic systems create clearer feedback loops between failure and correction: failures are visible, embarrassing, and spawn better security practices. Congressional capture is often invisible and legal. The Farm Bill has been getting worse since 1933. Neither system is perfect, and the process of updating algorithms in response to failures remains subject to political pressures, but algorithmic systems at least make failures visible.
Defense-in-Depth Architecture
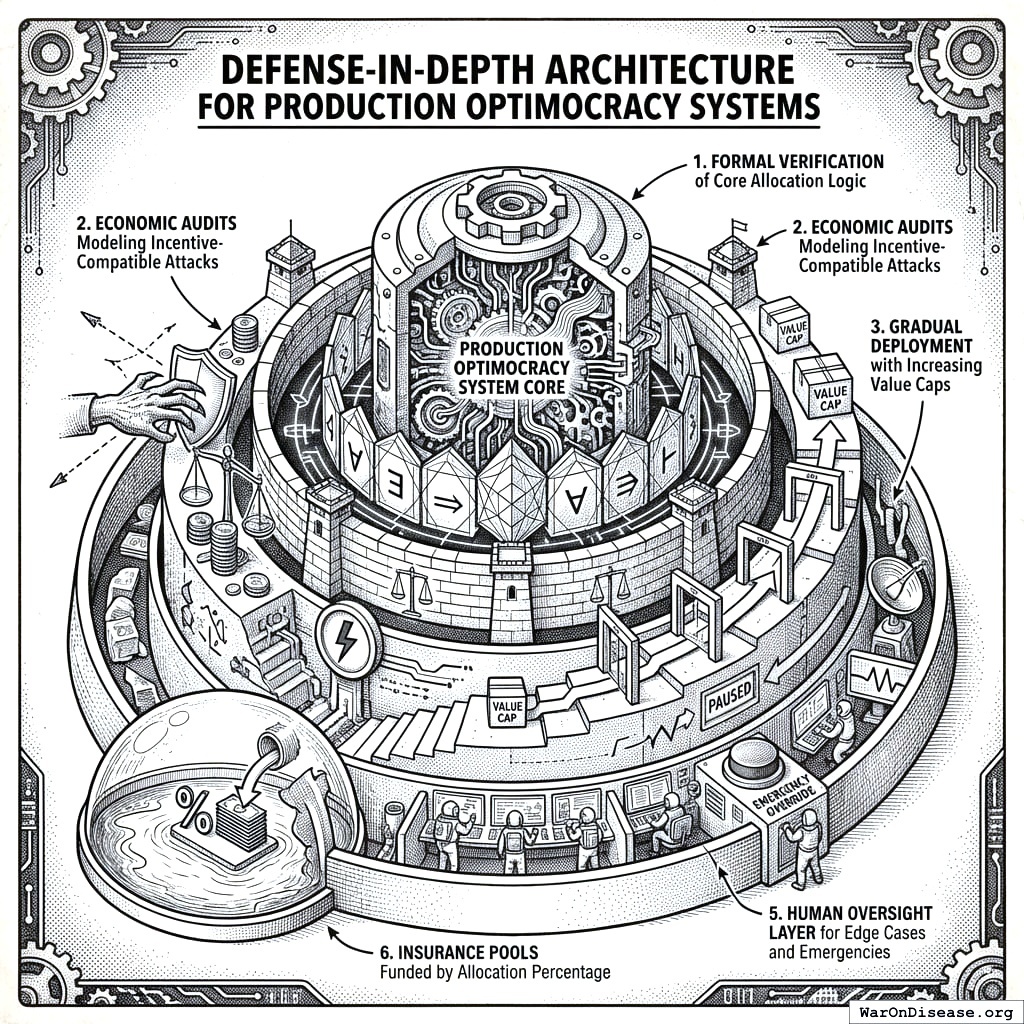
Production Optimocracy systems should implement:
- Formal verification of core allocation logic
- Economic audits modeling incentive-compatible attacks
- Gradual deployment with value caps that increase as the system proves reliable
- Circuit breakers that pause allocation if metrics move anomalously
- Human oversight layer for handling edge cases and emergencies
- Insurance pools funded by a percentage of allocations
Appendix B: Theoretical Background
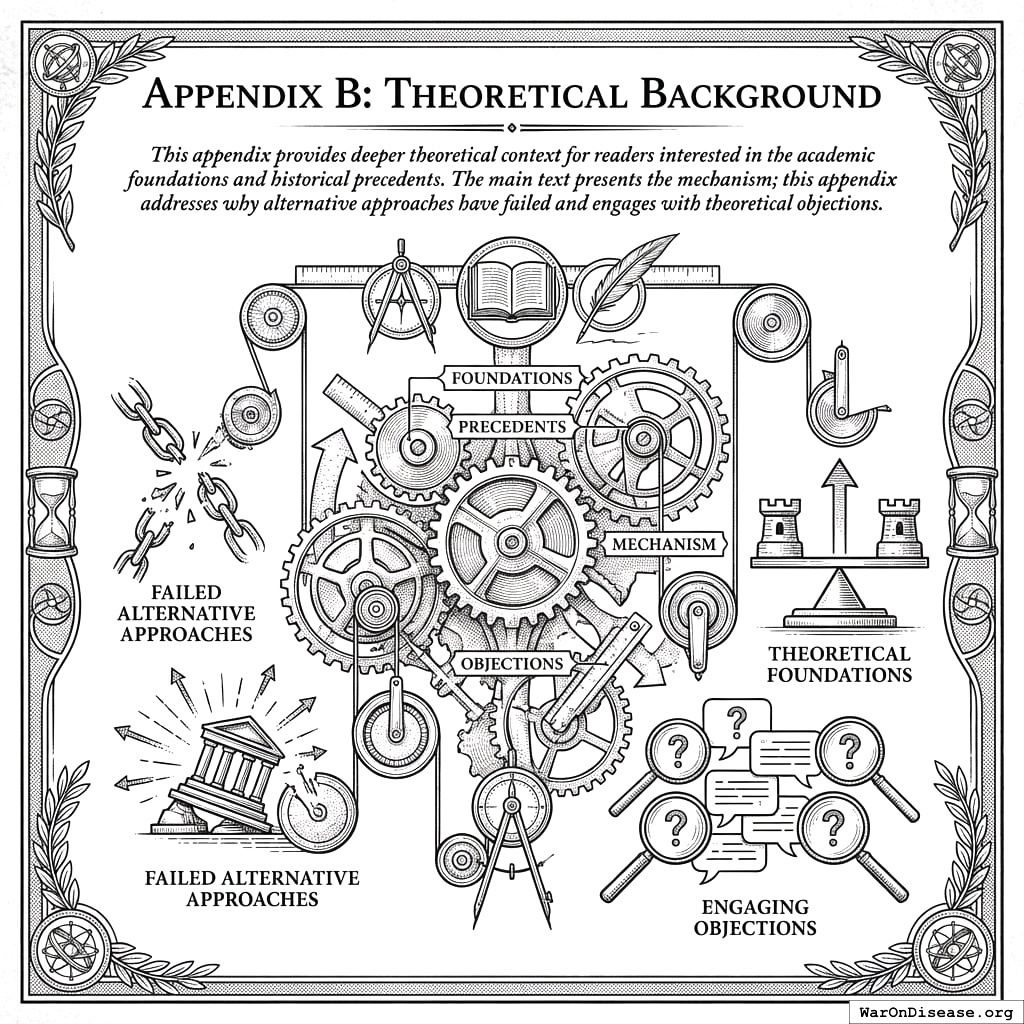
This appendix provides deeper theoretical context for readers interested in the academic foundations and historical precedents. The main text presents the mechanism; this appendix addresses why alternative approaches have failed and engages with theoretical objections.
Historical Precedents: Technocratic Governance Failures
Soviet Central Planning
The Soviet system attempted comprehensive optimization: central planners would calculate optimal production quantities and allocate resources accordingly. The failure was comprehensive:
- Knowledge problem139: Planners lacked the distributed information that prices aggregate in markets.
- Incentive problem: Planners had no personal stake in outcomes and faced perverse incentives.
- Scope problem: Central planning attempted to optimize everything, including decisions where local knowledge is essential.
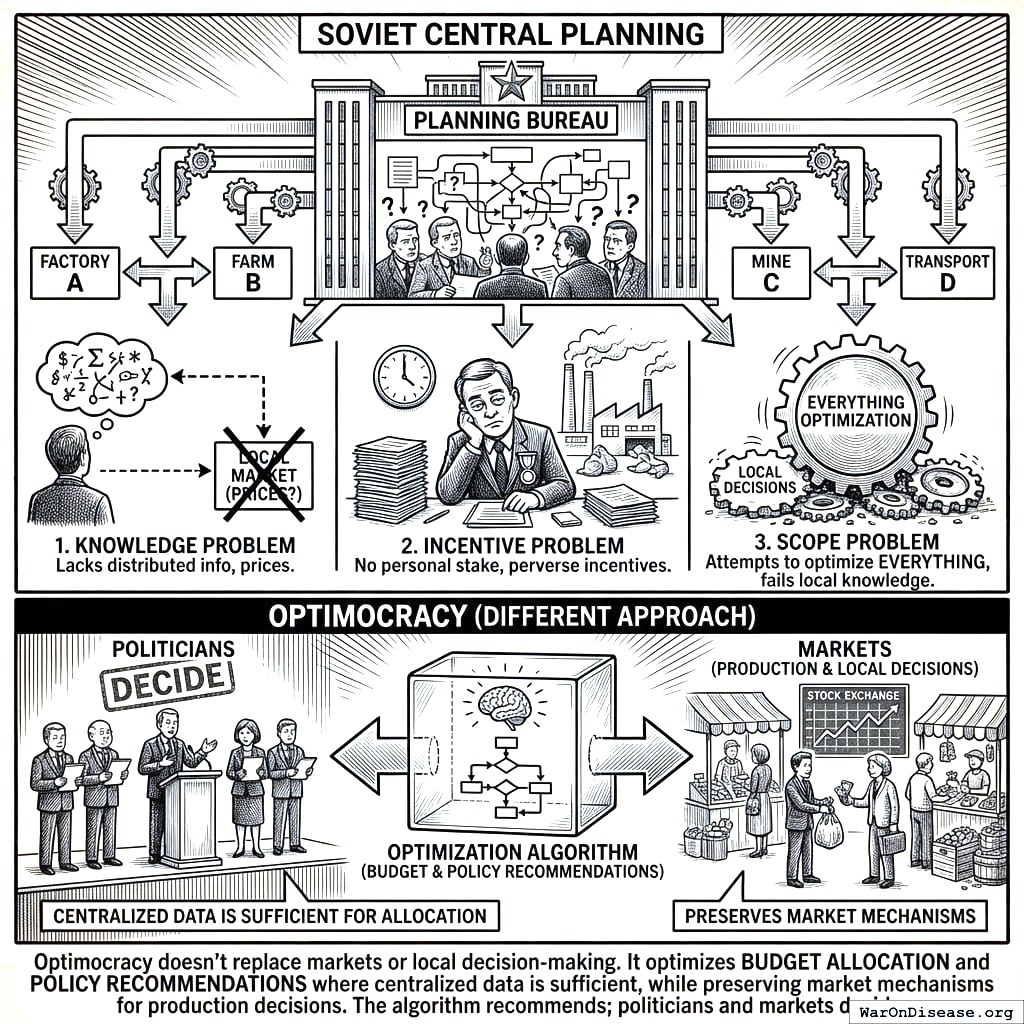
Why Optimocracy differs: Optimocracy doesn’t replace markets or local decision-making. It optimizes budget allocation and policy recommendations where centralized data is sufficient, while preserving market mechanisms for production decisions. The algorithm recommends; politicians and markets decide.
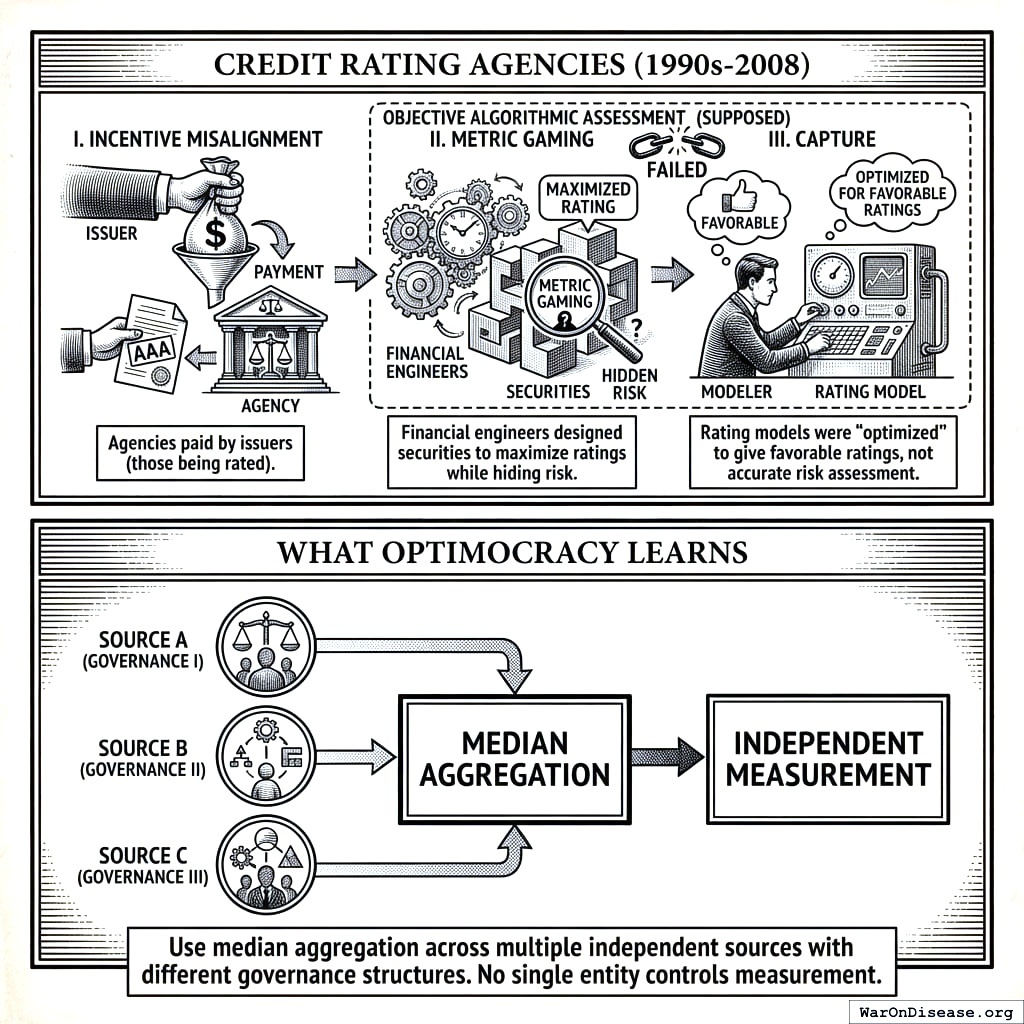
Credit Rating Agencies (1990s-2008)
Credit ratings were supposed to be objective, algorithmic assessments of default risk. Instead:
- Incentive misalignment: Agencies were paid by issuers (those being rated)
- Metric gaming: Financial engineers designed securities to maximize ratings while hiding risk
- Capture: Rating models were “optimized” to give favorable ratings, not accurate risk assessment
What Optimocracy learns: Use median aggregation across multiple independent sources with different governance structures. No single entity controls measurement.
Engaging with Impossibility Theorems
Arrow and Gibbard-Satterthwaite
159 proved no voting rule perfectly aggregates conflicting preferences.160 showed any voting rule can be strategically gamed.
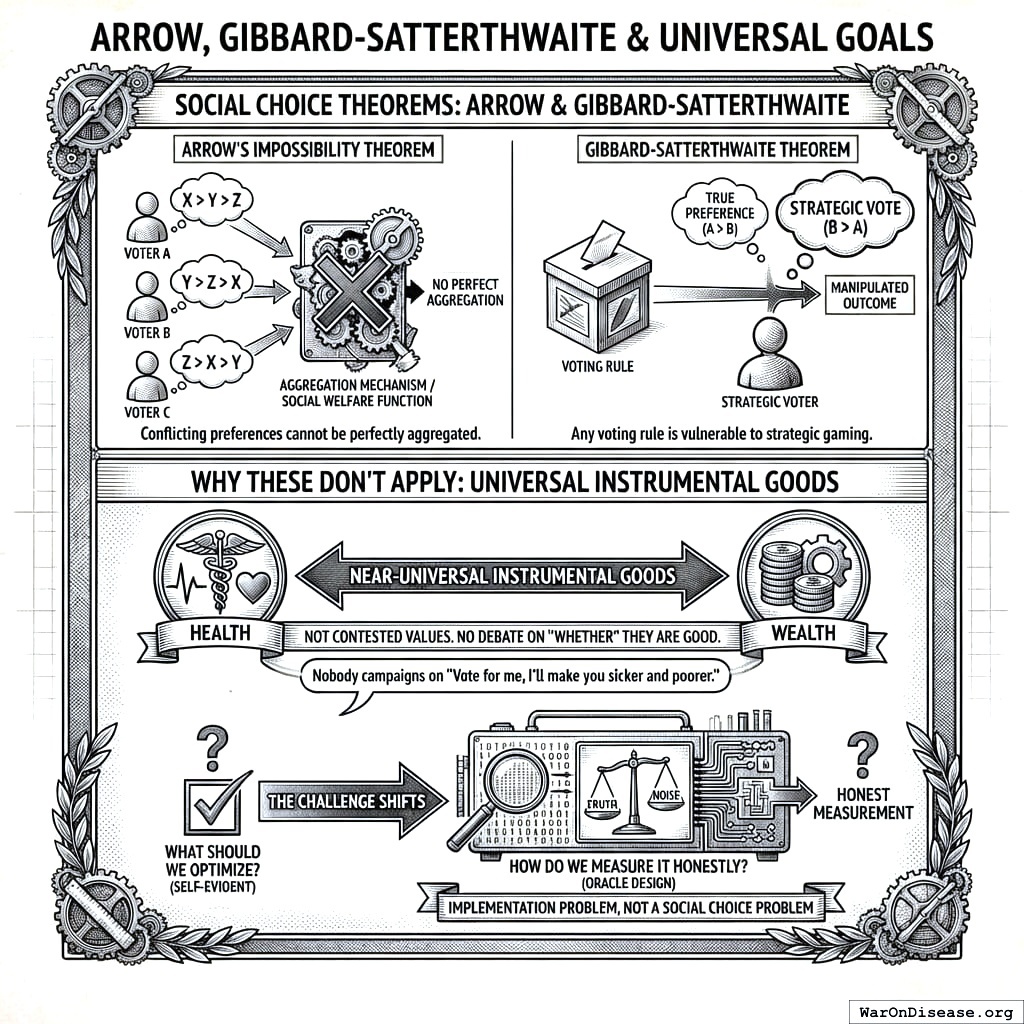
Why these don’t apply: Health and wealth are not contested values in the Arrow sense. They are near-universal instrumental goods. Nobody campaigns on “Vote for me, I’ll make you sicker and poorer.” The debate is always about how to achieve health and wealth, never whether they’re good.
The challenge shifts from “what should we optimize?” (self-evident) to “how do we measure it honestly?” (oracle design). That’s an implementation problem, not a social choice problem.
Mechanism Design: The Revelation Principle
The Revelation Principle161,162 states that data reporters only tell the truth when lying costs more than it’s worth.
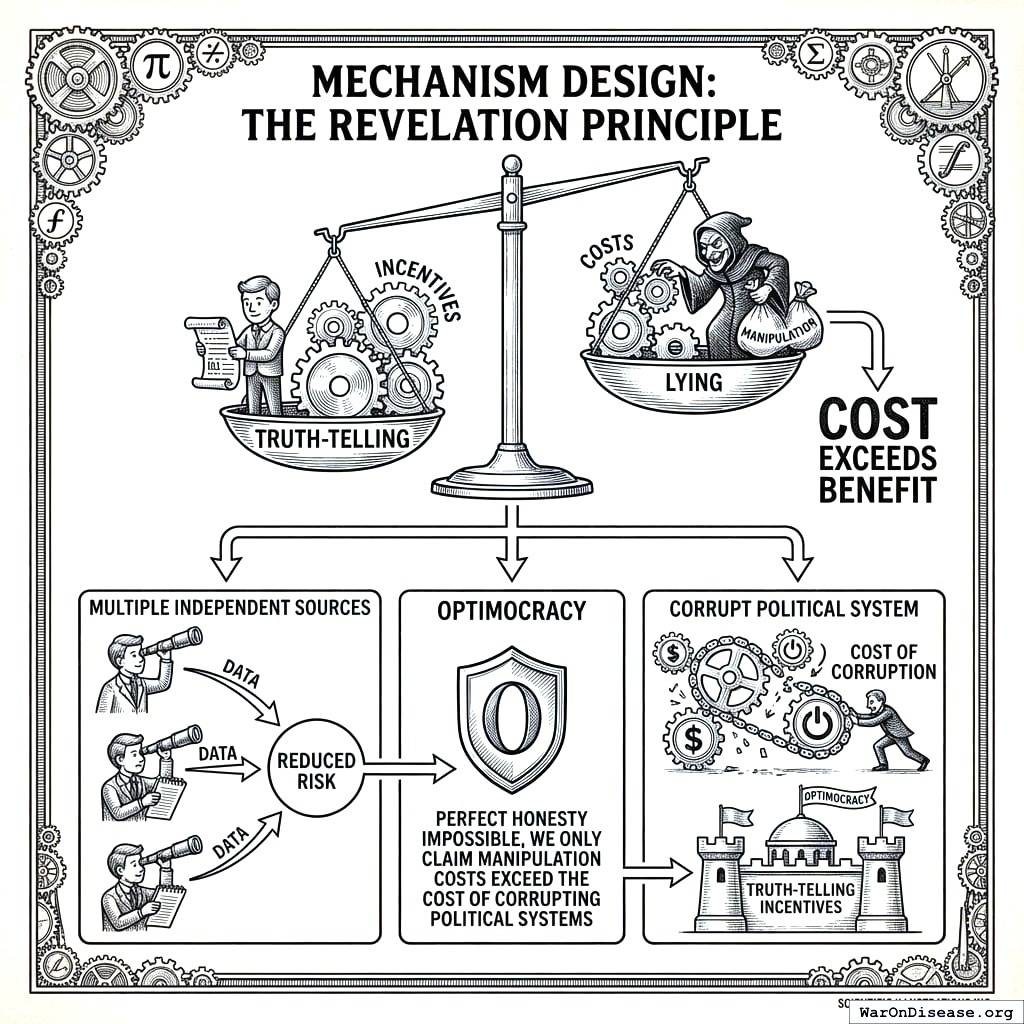
What this means for Optimocracy:
- Data reporters need incentives for truth-telling
- Multiple independent sources reduce manipulation risk
- Perfect honesty may be impossible; we only claim manipulation costs exceed the cost of corrupting political systems
Democratic Legitimacy: A Deeper Analysis
The concern is not whether Optimocracy would work technically, but whether citizens would accept it as legitimate governance. Democratic theorists from Rousseau to Habermas argue that the process of collective decision-making has intrinsic value.
The objection has real force. On this view, a benevolent dictator who maximized welfare would still be illegitimate because citizens didn’t author their own laws.
Responses:
| Response | Key Point |
|---|---|
| More democratic, not less | Current system offers ritual (voting) but delivers oligarchy (136). Optimocracy delivers what citizens actually voted for. |
| Citizens choose the goal | We already delegate implementation to the Fed and FDA. |
| Universal values | Health and wealth aren’t contested preferences. We’re measuring what humans universally value. |
| Legitimacy evolves | Social Security and index funds were controversial initially. |
| The alternative is capture | The realistic choice is captured allocation dressed in democratic ritual. |
There is a genuine tension between outcome legitimacy (governance produces outcomes citizens want) and process legitimacy (citizens meaningfully participate in decisions). Optimocracy prioritizes outcome legitimacy while preserving process legitimacy through the wrapper architecture: politicians still decide everything; they just face new incentives and new information.
Boundary Conditions for Algorithmic Governance
The historical record suggests algorithmic governance works under specific conditions:
| Condition | Favorable | Unfavorable |
|---|---|---|
| Metric clarity | Single, measurable objective | Multiple, contested objectives |
| Knowledge requirements | Aggregable statistics sufficient | Distributed local knowledge essential |
| Value consensus | Broad agreement on objective | Fundamental value conflicts |
| Scope | Narrow domain | Comprehensive planning |
| Accountability | Clear consequences for failure | Diffuse responsibility |
Optimocracy operates in domains where conditions are favorable (budget allocation, policy evaluation) and defers to democratic deliberation where they are not (value conflicts, novel situations requiring judgment).
Acknowledgments
Thanks to colleagues and reviewers who shared feedback on early drafts. Any remaining errors are mine.