Algorithmic Public Administration
A Protocol for Replacing Government Intermediaries with Deterministic Functions
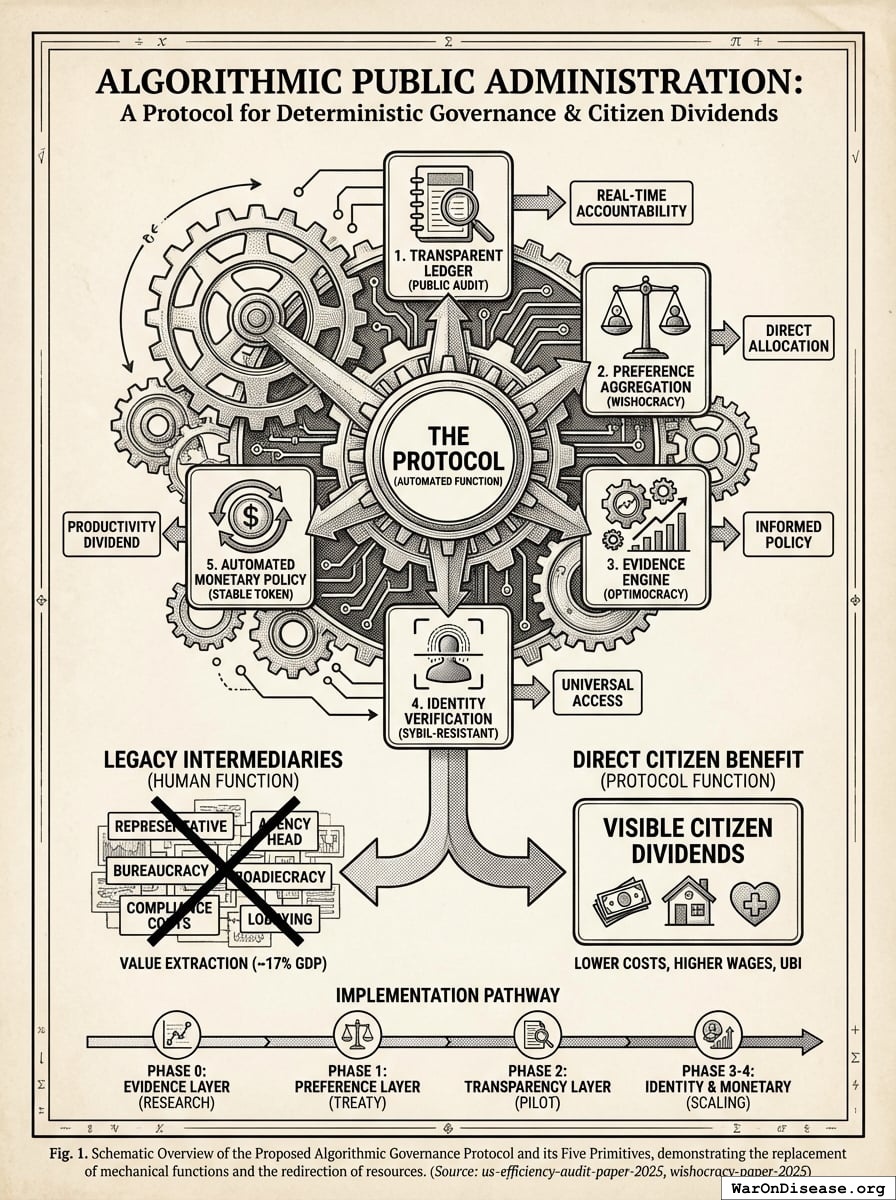
Government agencies are chains of humans passing paper to other humans, each checking whether the previous human filled out the right form rather than whether anyone got helped. In the United States alone, this intermediation destroys or diverts $4.98 trillion (95% CI: $4.39 trillion-$5.61 trillion) per year, or 17.3% (95% CI: 15.3%-19.5%) of GDP170. We describe a protocol combining five primitives (transparent ledger, preference aggregation, evidence engine, identity verification, and automated monetary policy) that replaces specific mechanical functions currently performed by the Federal Reserve, Internal Revenue Service, Social Security Administration, Government Accountability Office, Congressional Budget Office, Office of Management and Budget, Federal Election Commission, and Census Bureau. The protocol preserves democratic control: citizens still decide resource allocation through pairwise preference comparison (Wishocracy171). The algorithm executes those decisions without extracting value at each administrative layer. We distinguish fiscal cash the protocol can route directly into UBI from broader societal gains that arrive as lower prices and higher wages, and we describe a phased implementation pathway compatible with the 1% Treaty172 funding mechanism.
algorithmic-governance, public-administration, mechanism-design, government-efficiency, direct-democracy, monetary-policy, universal-basic-income, preference-aggregation
Intermediation cost of governance in the United States: $4.98 trillion (95% CI: $4.39 trillion-$5.61 trillion) per year. People employed to execute functions that are algorithmic in nature: millions. Time since the technology to replace them became available: 17 years. Number of agencies replaced: zero. This is a technical specification for the obvious.
Introduction
A citizen who wants cancer research funded must persuade a representative, who must negotiate with other representatives, who must instruct an agency head, who must direct a bureaucracy, who must process applications, who must distribute funds. Six intermediaries between “I want this” and “this happens.” Each layer extracts value (salaries, overhead, compliance costs) and introduces preference distortion (lobbying, logrolling, regulatory capture). The aggregate cost of this intermediation in the United States alone is $4.98 trillion (95% CI: $4.39 trillion-$5.61 trillion) per year170, or 17.3% (95% CI: 15.3%-19.5%) of GDP.
Most of what these intermediaries do is mechanical. Tax calculation, benefit distribution, budget allocation, auditing, census enumeration: these are algorithms being executed by humans. Humans are slower, more expensive, and more susceptible to capture than actual algorithms. They also require lunch breaks, health insurance, and the occasional bribery budget.
This paper describes a protocol that replaces specific mechanical agency functions with deterministic code while preserving democratic control over what those functions do. Citizens still decide how resources are allocated, through pairwise preference aggregation (Wishocracy171). The protocol executes their decisions without extracting value at each administrative layer.
We do not propose replacing government. We propose replacing the intermediaries between citizens and governance outcomes. Democracy is a decision-making system, not an employment program. The functions that require human judgment (enforcement, diplomacy, adjudication) remain human. The functions that are algorithmic in nature become actual algorithms. This is the same category of innovation as the dishwasher. The dishwasher replaced dishwashing, not cooking. Nobody argued that dishes required human judgment. Nobody wrote an op-ed titled “In Defense of Dirty Dishes.” The objections to algorithmic governance are identical to the objections people would have raised about dishwashers if dishwashers also eliminated the jobs of people who write regulations about dishwashing.
The Cost of Intermediation
The United States Efficiency Audit170 identifies four categories of governance waste:
- Direct spending waste: $1.1 trillion (95% CI: $1.03 trillion-$1.17 trillion)/year in military overspend beyond deterrence requirements, corporate welfare, agricultural subsidies paid to not produce food, fossil fuel subsidies, and drug war enforcement
- Compliance burden: $1.13 trillion (95% CI: $856 billion-$1.49 trillion)/year in tax compliance costs ($546 billion (95% CI: $450 billion-$650 billion)) and regulatory red tape ($580 billion (95% CI: $290 billion-$1 trillion))
- Policy-induced GDP loss: $1.56 trillion (95% CI: $1.11 trillion-$2.1 trillion)/year from housing supply restrictions ($1.4 trillion (95% CI: $500 billion-$2 trillion)) and tariffs ($160 billion (95% CI: $90 billion-$250 billion))
- System inefficiency: $1.2 trillion (95% CI: $1 trillion-$1.44 trillion)/year in healthcare system waste ($1.2 trillion (95% CI: $1 trillion-$1.5 trillion))
Total: $4.98 trillion (95% CI: $4.39 trillion-$5.61 trillion)/year. The Political Dysfunction Tax58 extends this analysis globally, estimating $101 trillion (95% CI: $59.6 trillion-$161 trillion)/year in opportunity costs from suboptimal governance worldwide. Two adjacent gains sit outside that $4.9T audit arithmetic and are treated separately in this paper: roughly ~$500B/year in recovered tax gap and roughly ~$1.1T/year in excess financial intermediation rent, with ~$2.3T/year as the gross bank-tollbooth ceiling.
At 335 million people, the conservative quantified stack in this paper is roughly $19,800 per person per year, or about $79,000 for a family of four. About $4,900 per person can be routed directly into visible UBI under the protocol’s default rule. Another ~$14,900 per person arrives as lower prices, lower fees, less compliance labor, and higher wages. Using the full $2.3T finance ceiling instead of the $1.1T excess estimate raises the total to roughly $23,400 per person. The point is not that every dollar becomes a Treasury transfer. The point is that every dollar stops being siphoned off by intermediaries.
Every category traces to the same root cause: intermediaries whose incentives diverge from the citizens they serve. The IRS is expensive because the tax code is complex. The tax code is complex because legislators sell exemptions to donors. Donors buy exemptions because the return on investment is extraordinary. The exemptions require interpretation, which requires accountants, which creates a compliance industry, which lobbies for more complexity, which produces more exemptions to sell. This is not dysfunction. This is the system performing as designed. Each participant is acting rationally within a structure that produces irrational outcomes. The protocol described in this paper removes the structure.
System Architecture
The protocol has five parts:
Transparent ledger. Every government transaction recorded on a shared, publicly auditable ledger. Private settlements record only the minimal fields needed for tax collection and macro measurement, with identities and item-level details proved privately. Eliminates ex-post auditing (GAO) and opacity-dependent corruption.
Preference aggregation (Wishocracy). Verified citizens in the relevant jurisdiction express resource allocation preferences through ~20 pairwise comparisons. The RAPPA algorithm171 produces budget weights via eigenvector decomposition and, when legal change is required, direct rule mandates. Eliminates congressional appropriations, OMB, and much committee bargaining.
Evidence engine (Optimocracy). Cross-jurisdictional causal inference173 compares policy outcomes across thousands of jurisdictions and identifies which policies actually make people richer and less dead (median income, healthy life years). Eliminates the CBO’s scoring function.
Identity layer. Continuous, sybil-resistant citizen verification. Every verified citizen receives equal allocation weight and equal UBI distribution. Eliminates the decennial census and means-testing bureaucracy.
Automated monetary policy. Fixed algorithmic rule targeting 0% change in a rule-bound purchasing-power basket. A final-consumption settlement tax funds the budget, a separate stabilization component is burned or parked in reserve as needed, and new money creation equals productivity growth. The productivity dividend is distributed equally via UBI. Eliminates the Federal Reserve’s discretionary monetary policy.
These five primitives are interdependent. An engineer would call this a system. Your species calls it five separate agencies with five separate budgets, five separate directors, and five separate lobbying targets. The ledger enables accountability without auditors. Wishocracy enables allocation without appropriators. The evidence engine enables informed preferences without policy analysts. Identity enables distribution without means-testing. Monetary policy enables stable prices without central bankers. Remove any primitive and the system degrades.
Monetary Policy and Revenue
The Problem
The full case against discretionary monetary policy fills its own chapter. The short version: twelve unelected people sit around a table and decide how much your money is worth. The dollar has lost 96% of its purchasing power since they started. New money enters the economy at the top (banks, government contractors) and reaches citizens last, after each intermediary has captured value. This is the Cantillon effect. It is not a bug. It is the system. The mechanism has funded unpopular wars that killed 310 million people without requiring democratic consent for any of them. The technology to replace the table has existed since 2009. Your species is using it to trade pictures of monkeys.
The FairTax, Implemented Algorithmically
The tax and monetary architecture is not novel. It is the FairTax (a consumption tax replacing all income taxes, with a universal prebate) implemented at the protocol level with three modifications: (1) collection happens automatically at settlement, (2) the displayed rate is set by an algorithm instead of Congress, and (3) the prebate is a daily UBI deposit instead of a monthly check.
The system has two moving parts:
The settlement tax replaces all income, payroll, capital gains, corporate, and estate taxes with a single flat percentage collected automatically at final-consumption settlement. Consumer purchases are taxed. Transfers between registered business accounts, capital formation, and pure balance-sheet reallocations are zero-rated automatically by wallet type, so the tax does not pyramid through supply chains. No filing. No deductions. No code. No IRS. The consumer sees one number at checkout.
Behind that one visible rate are two destinations. The fiscal component funds the government’s wishocratically-determined budget. The stabilization component does not fund spending; when activated, it is burned or parked in a non-spendable reserve until the purchasing-power basket returns to target. This is the minimum machinery required to avoid a conceptual error: the same tax dollar cannot both finance expenditure and disappear from circulation.
Once every citizen and business can hold verified settlement wallets directly on the protocol, banks cease to be necessary as deposit warehouses, payment rail operators, and first receivers of new money. What survives is lending. Underwriting default risk, duration risk, and project selection remain real work. Mortgages, business loans, and venture finance still exist, but they are funded by competitive credit pools layered on top of the protocol rather than by institutions that also control custody and payments.
The UBI deposit replaces means-tested cash welfare with a daily payment to every verified citizen. UBI has three funding streams, each from a different source:
- Structural dividend: all fiscal cash the protocol directly captures or consolidates by default: eliminated agency operating costs, reclaimed direct spending waste, recovered tax gap, and the transfer-like portion of the welfare state rewritten from category-specific entitlements into equal cash. In long-run steady state, retirement cash support can be folded into the same base as legacy promises roll off. What remains outside the universal cash stream is not an open-ended sympathy bureaucracy but a narrow catastrophic frontier (the short list of disasters too expensive for any one person to handle alone): pooled catastrophic risk, child-linked funding, and incapacity management for citizens who literally cannot manage cash on their own behalf.
- Productivity dividend (this section): new currency minted by the algorithm to prevent deflation as the economy grows. This is the Cantillon pipeline, redirected from banks to citizens.
- Democratic supplement: whatever additional share of the ordinary discretionary budget citizens explicitly choose to direct to cash transfers versus other public goods.
The citizen sees one deposit, but the sources are distinct: captured fiscal cash, monetary issuance, and democratic choice.
These are the monetary control levers:
- Prices rising (inflation): The algorithm increases the stabilization component of the settlement tax. Those receipts are not spent back into the economy. They are retired or sequestered until the price basket returns to target. The fiscal component changes only as needed to fund the budget.
- Prices falling (deflation from productivity growth): The algorithm reduces the stabilization component toward zero. If prices continue falling because output is growing faster than money velocity, the algorithm mints new currency and distributes it via the productivity dividend. This is new money representing real economic growth, entering at the bottom instead of the top.
The combination of a fiscal rate, a temporary sterilization rate, and a productivity dividend maintains stable purchasing power without human discretion.
Why 0% and not deflation. A growing economy with a fixed money supply produces natural deflation: more goods, same money, falling prices. The central-banks chapter documents that the longest sustained deflation in American history (1870-1896) coincided with explosive economic growth. Natural deflation works. But the protocol targets 0% inflation instead, for three reasons:
- Adoption. “$200 per month in your account” is a campaign slogan. “Prices fell 1.8% and your purchasing power increased by an equivalent amount” is a lecture. The protocol needs adoption. Adoption requires a benefit people can feel. Cash is felt. Deflation is not.
- Debt neutrality. Deflation makes existing debts more expensive in real terms. Every mortgage, student loan, and business loan costs more when prices fall. The 0% target is neutral: it neither inflates away debts (theft from savers) nor deflates them larger (punishment for borrowers).
- The real complaint is distribution, not deflation. The central-banks chapter argues against the Federal Reserve. The core objection is not “deflation should be allowed.” It is “new money should not go to banks first.” The protocol fixes the distribution. New money is still created (to prevent deflation), but it enters at the bottom (UBI to every citizen) instead of the top (Cantillon pipeline to banks). The same productivity gains reach the same citizens. The check just arrives as cash instead of as imperceptibly cheaper groceries.
This is a pragmatic choice, not a theoretical one. An economically purer design would allow natural deflation and skip the monetary UBI entirely. The structural dividend would still exist. But the productivity dividend distributed as cash is the single most powerful adoption incentive the protocol has. Theoretical purity that never gets adopted helps nobody.
Where the Inflation Money Goes
Under the current system, the Federal Reserve creates new money and routes it through banks. The banks lend it, spend it, or invest it before prices adjust. By the time rising prices reach your grocery store, the purchasing power has already been captured by whoever touched the new money first. This is not a side effect. It is the product. The Fed expanded its balance sheet by roughly $4.8 trillion in 2020-2022 alone. The top 1% gained approximately $4 trillion in net worth over the same period. This is considered a coincidence by people who benefit from it being considered a coincidence. The mechanism is the Cantillon effect described in the central-banks chapter, and it has been operating for over a century.
Under the protocol, when new money must be created to keep the basket stable as output grows, it is created at the bottom and distributed equally. The productivity dividend goes directly to every verified citizen in the jurisdiction as UBI. The monetary function is the same. The first receiver changes.
This is not a new discretionary privilege layered on top of the old system. It is the monetary function the Federal Reserve already performs, reassigned from banks to citizens. The claim is not that every future issuance episode will match some past Fed episode dollar-for-dollar. The claim is that whenever money creation occurs, the Cantillon advantage disappears.
Why Not CPI
The algorithm targets 0% change in a purchasing-power basket. The measurement matters. If the price index is wrong, the algorithm stabilizes the wrong thing.
The Consumer Price Index (CPI), compiled by the Bureau of Labor Statistics, has well-documented biases that systematically understate inflation:
- Substitution bias. When steak gets expensive, the BLS assumes you switch to chicken. “Inflation” stays low because the basket changed, not because prices did. You ate worse. The index says you are fine.
- Hedonic adjustment. Your laptop costs the same as last year but has a faster processor. The BLS counts this as a price decrease. You paid the same amount. The index says you paid less.
- Owner’s equivalent rent. Instead of measuring what housing actually costs, the BLS asks homeowners what they think their house would rent for. Housing prices doubled in many markets between 2020 and 2024. CPI barely noticed.
- Geometric weighting. A technical adjustment that systematically lowers the measured rate by assuming you keep switching to whatever is cheapest. This is a math trick that makes inflation smaller on paper.
The institution compiling CPI is the same government that benefits from reported inflation being low (lower Social Security COLA adjustments, lower inflation-indexed bond payouts, lower TIPS returns). No sane audit process lets the defendant grade their own exam.
The protocol uses a different metric: a rule-bound purchasing-power basket derived from actual settlement data on the ledger. The algorithm does not rely on surveys or hedonic imputations. It observes actual cleared prices. For private transactions, the ledger exposes only the fields needed for macro measurement and tax collection: amount, standardized category, jurisdiction, and time bucket. Identities, counterparties, and item-level receipts remain private and are validated with zero-knowledge proofs. There is no owner’s-equivalent-rent fiction because the system uses actual rents and observed housing transaction data.
The price index is anchored to essential goods: energy, food, housing, healthcare, and a precious metals component (gold and silver) that provides a manipulation-resistant floor. Basket weights are derived from observed spending patterns, locked for a governance interval, and updated only on a public schedule rather than continuously chasing substitution patterns. The entire calculation is public and auditable on the ledger. Anyone can verify it. Nobody can adjust it.
Why No Gold Standard
The central-banks chapter demonstrates that gold-anchored systems produced broad-based prosperity (Bretton Woods, the classical gold standard) while fiat systems produced wage stagnation and wealth concentration. A reasonable person might conclude: go back to gold.
The protocol achieves the gold standard’s benefit (constraining money creation) through a different mechanism. Gold constrained money creation by requiring a physical reserve. The algorithm constrains money creation by targeting a purchasing power index. Both prevent politicians from printing money for wars or bailouts. The algorithm has three advantages over gold:
- It can accommodate growth. Under a gold standard, a growing economy produces deflation (more goods, same gold supply), which passively rewards existing holders. The algorithm creates exactly enough new currency to keep prices stable, distributing the growth dividend to citizens instead of to vaults.
- It cannot be suspended. Every gold standard in history was abandoned when a government needed to fund a war. The algorithm runs on a distributed ledger that no single government controls. Suspending it requires a majority of nodes, not a Sunday evening press conference.
- It is auditable in real time. The total money supply, public spending flows, and the macro fields used by the monetary rule are visible on the ledger. Gold reserves required trusting that the metal was actually in the vault. (It frequently was not. See: Nixon, 1971.)
The “backing” is not a metal. It is a guarantee: this currency will buy the same basket of goods tomorrow as it does today. That is a stronger guarantee than “this currency can be exchanged for a specific weight of a metal whose own value fluctuates based on jewelry demand and mining output.”
What This Replaces
| Current System | Replacement | Mechanism |
|---|---|---|
| Federal Reserve (12 FOMC members, ~24,000 staff, ~$6.8B/year) | Deterministic algorithm | 0% inflation target; cannot be lobbied |
| 2% annual inflation (96% cumulative loss since 1913) | 0% target | Stable purchasing power |
| Cantillon effect (proximity to printer = wealth) | Equal-entry money creation | New money enters at the bottom |
| Commercial banks as money utilities | Protocol wallets + competitive credit funds | Custody and settlement become protocol functions; lending remains a risk-priced service |
| Income/payroll/capital gains taxes + IRS | Algorithmic final-consumption settlement tax | Collected automatically at settlement |
| Congressional tax rate debates | Automated fiscal + stabilization adjustment | Budget funding separated from monetary control |
The Tax System It Replaces
The previous section describes the protocol’s final-consumption settlement tax. This section describes what it replaces, and why the replacement is overdue.
In 1913, the federal income tax fit in 27 pages. Today, the federal tax system (the Internal Revenue Code plus Treasury regulations, rulings, and case law) fills approximately 74,000 pages of the CCH Standard Federal Tax Reporter. Each page beyond the original 27 represents a successful lobbying effort: an exemption, a deduction, a credit purchased by an industry that benefits from it. The tax code is not a revenue collection mechanism. It is a geological record of every deal ever struck between a legislator and a donor, compressed into sedimentary layers of subsection and cross-reference.
Americans spend 6.1 billion hours per year on tax compliance. To put that in a unit humans can feel: the Apollo program employed 400,000 people at its peak. Americans dedicate the equivalent labor of 15 Apollo-scale workforces every year to tax paperwork. You could staff fifteen moon landings annually with the human effort currently dedicated to interpreting a document whose primary function is to be uninterpretable.
The IRS employs about 95,000 people (up from ~79,000 in 2021)174. The agency’s own operating budget is about $14 billion, while the tax system built around it imposes $546 billion (95% CI: $450 billion-$650 billion) per year149 in direct compliance burden on the rest of society. Regulatory compliance adds another $580 billion (95% CI: $290 billion-$1 trillion) per year58.
The compliance industry (tax preparers, accountants, software companies) has a structural interest in complexity. Intuit, the maker of TurboTax, has spent millions lobbying against IRS proposals to offer free, pre-filled tax returns. The IRS could pre-fill most returns using data it already has (employers report wages; banks report interest; brokerages report gains). It does not, partly because the compliance industry lobbies against it. You are paying to solve a problem that the people you are paying have a financial interest in not solving. There is a word for this. The word is “protection racket.” Your species uses the same word. You just don’t apply it when the racketeer files a 10-K.
What This Replaces
| Current System | Replacement | Savings |
|---|---|---|
| IRS (~100,000 employees) | Protocol-level function | $546 billion (95% CI: $450 billion-$650 billion)/year direct |
| 74,000-page tax code | One rate, applied uniformly | 6.1B hours/year compliance eliminated |
| Tax compliance industry | Ceases to exist | $200B+/year in private compliance costs |
| Tax evasion (~$600B/year net gap) | Low-rate settlement tax + UBI conditional on on-ledger identity | ~$500B+/year recovered |
The 27-page tax code of 1913 could have been a function. The 74,000-page version is a jobs program for people who interpret the function. The 74,000 intervening pages are the longest suicide note a tax system ever wrote. The protocol returns to the function.
Allocation
The Problem
The United States federal budget is approximately $6.8 trillion, allocated by 535 members of Congress through committee negotiations, floor votes, conference reports, and approximately $4.4 billion (95% CI: $3.74 billion-$5.06 billion) per year in lobbying. The CBO (275 analysts) scores proposed legislation over weeks or months. The OMB (~530 staff, $143M/year) prepares the President’s budget request. By the time the budget is enacted (if it is enacted; your government has shut down over 20 times since 1976 because 535 people could not agree on how to spend money), the document reflects donor preferences filtered through electoral incentives filtered through committee seniority filtered through floor amendments filtered through conference negotiations. At no point in this process does any citizen directly express a preference about how their money is spent.
You pick one human to represent your preferences on thousands of issues. This is like choosing a chef who will eat for you for four years. You wanted the salad. He ordered the war. You can pick a different chef in November, but only from a menu of two, and both chefs are being paid by the steak lobby.
Representatives are elected on bundled platforms (immigration + healthcare + defense + education), making issue-level preference expression impossible. A voter who wants more cancer research and less military spending cannot express this. They get a package deal, designed by consultants, funded by donors, and tested on focus groups. The package is designed to win elections, not to represent you. Resource allocation reflects the preferences of the people who funded the campaign, not the people who voted in it. This is the principal-agent problem operating at the scale of a $6.8 trillion budget, with a $4.4 billion (95% CI: $3.74 billion-$5.06 billion)/year lobbying industry whispering in the agent’s ear171.
The Protocol
Wishocratic preference aggregation replaces the appropriations process and, when needed, the committee bottleneck in rulemaking.
Each verified citizen in the relevant jurisdiction performs ~20 pairwise comparisons: “Would you prefer $100 toward medical research or $100 toward military spending?” The slider allows continuous allocation (85/15, 60/40), not binary choice. The RAPPA algorithm aggregates preferences into budget weights using eigenvector decomposition, the same mathematics that powers Google’s PageRank.
The Optimocracy evidence engine173 informs these comparisons. Before allocating, citizens see what actually works: “Investing $1 in cancer research produces $X in economic value over 10 years.” Preferences expressed with access to evidence differ systematically from preferences expressed without it. That is the point.
Budget weights update continuously. There is no annual budget cycle, no continuing resolution, no government shutdown. The algorithm does not need to agree with itself. It just does the math.
Some problems are budgetary and some are legal. If the question is how much to spend, Wishocracy allocates the money. If the question is whether a tariff, subsidy, or zoning restriction should exist, the same evidence interface presents a direct citizen rule vote instead of routing the decision through committees and donors.
What This Replaces
| Current System | Replacement | Mechanism |
|---|---|---|
| Congressional appropriations (535 members) | Verified citizens in the relevant jurisdiction, direct allocation | RAPPA eigenvector |
| OMB (~530 staff, $143M/year) | Wishocratic budget weights | Automated |
| CBO (275 analysts, months per score) | Optimocracy engine | Real-time empirical scoring |
| Grant committees | Wishocratic allocation weighted by DALYs | Disease burden determines funding |
| Lobbying industry ($4.4 billion (95% CI: $3.74 billion-$5.06 billion)/year) | No intermediary to lobby | Function ceases to exist |
Your government has shut down 20+ times because humans could not agree on a spreadsheet. The algorithm does not shut down. It has no opinion about the spreadsheet. It just fills it in.
Distribution
The Problem
The United States spends over $1.1 trillion per year on means-tested welfare programs across 89 federal programs. Of that, roughly $100 billion goes to administration: determining who qualifies, processing applications, verifying eligibility, preventing fraud. The defining feature of this system is not the benefits. It is the gate. The United States has built a system whose primary purpose is to determine whether you deserve help, and whose primary effect is to ensure you don’t get it in time.
The administrative cost per dollar distributed varies by program, but the pattern is consistent: a significant fraction of every welfare dollar goes not to the poor person but to the bureaucracy deciding whether they are poor enough. SNAP (food stamps) spends roughly 6-7% on administration. Medicaid spends approximately 5%. Housing assistance programs spend roughly 8% on administrative fees. These percentages sound small until you multiply them by hundreds of billions. The United States employs hundreds of thousands of people whose primary function is gatekeeping access to funds that, in many cases, cost less than the gate.
The cruelty is structural. The people who need help most (the disabled, the elderly, non-English speakers, the severely ill) are the least capable of navigating application processes. The system selects for form-filling ability, not need. A healthy 30-year-old with internet access can complete a SNAP application in an afternoon. A disabled 70-year-old who needs the benefits more urgently may not complete it at all. Social Security disability claims take an average of 7-8 months for initial determination (230 days in FY2024, up 81% from 121 days in 2019). Appeals take years. People die waiting. The system designed to prevent their suffering becomes, through administrative delay, the mechanism of their suffering.
The gate costs more than what is behind it. Removing the gate is not a radical policy innovation. It is arithmetic.
The Protocol
Universal Basic Income, deposited daily to every verified citizen via smart contract.
The UBI has three funding layers. The structural dividend is the fiscal cash the protocol directly captures or consolidates by default: eliminated agency operating costs, reclaimed direct spending waste, recovered tax gap, and the transfer-like portion of the welfare state rewritten from category-specific entitlements into equal cash. In long-run steady state, retirement cash support can be folded into the same base as legacy promises roll off. What remains outside the universal cash stream is not an open-ended sympathy bureaucracy but a narrow catastrophic frontier: pooled catastrophic risk, child-linked funding, and incapacity management for citizens who literally cannot manage cash on their own behalf. The productivity dividend is the monetary distribution described above. The democratic supplement is whatever additional share of the ordinary discretionary budget citizens allocate to direct cash transfers through wishocratic preference. This section is about the distribution mechanism: one account, one formula, one daily deposit.
No application. No eligibility determination. No means test. No caseworker. No waiting period. The ledger verifies citizenship (identity layer), calculates the per-citizen amount (total UBI pool / citizen count), and distributes. Every day. To everyone.
Maximum workable UBI does not mean pretending one flat check can replace civilization. It means cashing out everything that is fundamentally a transfer and making the residual exception layer brutally rule-bound. Catastrophic health risk remains pooled through a protocol-defined catastrophic insurance layer rather than a caseworker gate or a blank-check entitlement. Child education remains a per-child voucher or credit rather than adult cash. Everything else that is basically a transfer becomes cash. This should take about a week to figure out. It has taken your species 89 federal programs.
The federal layer should therefore do only four things in distribution: guarantee the universal cash floor, guarantee catastrophic portability, finance child-linked base funding, and move money. States and localities should handle most service delivery: schools, land use, provider markets, supplementary services, and local top-ups. Incapacity cases are handled through explicit representative-payee or guardianship rules, not by recreating a giant means-tested bureaucracy. That is the maximum-cash design that still respects risk pooling, children, and federalism.
The Objective Function
If this system is serious, it should be designed for how people actually behave, not how you wish they would. The terminal values are stated in What Matters: increase pleasant consciousness and reduce unpleasant consciousness. The protocol cannot measure those directly, because your agencies struggle to count office chairs. Its terminal general-welfare metrics are the same two used in Optimocracy: real after-tax median income and median healthy life years. Everything else here is mechanism design in service of moving those metrics without letting people game them.
At the protocol-design level, the target can be written as:
\[ \max_R \left[\Delta \widetilde{Y}^{\text{after-tax}}_{\text{median}}(R) + \theta \, \Delta \widetilde{HLY}_{\text{median}}(R)\right] - \lambda A(R) \]
where \(\widetilde{Y}^{\text{after-tax}}_{\text{median}}\) is real after-tax median income, \(\widetilde{HLY}_{\text{median}}\) is median healthy life years, and \(A(R)\) is the arbitrage value the rule set itself creates for gaming, lobbying, overbilling, denial, or misreporting. Median rather than average is the point: the protocol is trying to make the person in the middle richer and less dead, not make national aggregates prettier while rents concentrate at the top.
In practice, that means maximizing what citizens actually get, given two constraints: money is finite, and people will game whatever you build:
\[ \max_R \sum_i \mathbb{E}\left[u(c_i) + \alpha h_i + \beta s_i - \delta d_i\right] - \lambda A(R) \]
where \(c_i\) is disposable consumption, \(h_i\) is health and human-capital outcome, \(s_i\) is insurance against ruin, \(d_i\) is delay and compliance burden, and \(A(R)\) is the same arbitrage term above. In plain English: maximize median after-tax income and median healthy life years by increasing cash, reducing ruin risk, and minimizing the profit available from manipulating the system.
- Citizens maximize consumption, security, and autonomy. Therefore ordinary redistribution should arrive as unconditional cash. People spend their own money with better local information than a bureaucracy ever has.
- Patients respond to marginal price on routine care but cannot rationally self-insure million-dollar tail risk. Therefore routine care should run through a personal health wallet with rollover, while catastrophe should be pooled.
- Providers maximize reimbursement, not abstract national welfare. Therefore catastrophic coverage should pay published reference or bundled prices, not whatever invoice a hospital emits.
- Insurers and third-party administrators maximize spread by selecting risks, narrowing networks, and denying claims. Therefore they may administer claims or offer supplemental coverage, but they should not control core eligibility, underwriting, or the catastrophic frontier.
- Politicians maximize reelection, donations, and patronage. Therefore recaptured cash should sweep automatically into the structural dividend instead of waiting for annual appropriation horse-trading.
- Bureaucracies maximize budget, headcount, and discretionary turf. Therefore formulas should replace eligibility judgment wherever objective data exist.
- States and localities maximize local voter satisfaction and tax-base protection. Therefore they should control delivery and top-ups, while the federal layer finances a portable floor so jurisdictions cannot dump expensive residents.
Once the utility functions are stated honestly, the design rules become obvious. Give decision rights to the actor with the best local information only when that actor also bears the marginal cost. Citizens decide ordinary consumption from cash. Patients decide routine care from rolling health balances. Providers do not decide the public price of catastrophe. Insurers do not decide who is insurable. Politicians do not get to convert the dividend back into patronage. The point of the protocol is not to assume virtue. It is to leave every actor with less profitable ways to cheat.
The exception rule is ex-ante insurance, not ex-post rescue theater. A category belongs in the public catastrophic layer only if citizens, before knowing who will get sick, would rationally choose to pool that risk rather than take the same dollars as equal cash. In practice, that means five constraints:
- Catastrophic: the loss is too large for ordinary households to self-insure.
- Objective: the trigger is hard to fake.
- Low-frequency / high-severity: this is insurance, not routine spending.
- Reference-priced: the system pays a published schedule, not any number a provider writes down.
- Frontier-tested: the expected welfare gain beats the next-best use of the same dollars, which in this design is usually equal UBI.
One practical implementation is to publish a constitutional catastrophic budget, pay only reference prices, and require every covered intervention to clear a maximum cost-effectiveness threshold benchmarked to $100,000 per QALY unless citizens explicitly vote to fund a different threshold. The public question is therefore never “is this person suffering?” Suffering is everywhere. The question is “does this class of risk beat cash at the margin?” If a proposed intervention fails the catastrophic frontier, public reimbursement is zero. A one-patient trillion-dollar rescue does not become socially optimal just because it is heartbreaking.
Patient cost-sharing should follow the same logic. The place for skin in the game is routine spending, not catastrophe. Preventive care should be zero-price. Ordinary, non-catastrophic care can be paid first from a small personal health wallet funded by an automatic carve-out from UBI or by explicit state/local top-ups. Unused balances roll forward, so economizing benefits the patient directly instead of vanishing into an insurer’s margin. Once a covered episode crosses the catastrophic threshold, the protocol insurance layer pays the reference price and patient cost-sharing falls to zero or a token amount. If a patient chooses a provider charging above the published reference price, the patient pays the difference from ordinary cash.
This matters because most healthcare gaming is provider-side, not patient-side. Upcoding (billing for a disease you don’t have), unbundling (splitting one procedure into five invoices), fake complexity (making simple things look difficult so they cost more), network games (shuffling patients between networks to avoid caps), and price opacity (hiding prices so you can’t shop) are not fixed by scaring patients away from the emergency room. The anti-abuse stack should therefore be reference pricing, bundled payments, transparent outcomes, and anomaly detection first, with modest routine cost-sharing only as a secondary discipline mechanism.
What This Replaces
| Current System | Replacement | Mechanism |
|---|---|---|
| SSA (benefit calculation + distribution) | Single smart contract function | distribute(total / citizenCount) |
| Cash welfare (SNAP, TANF, SSI) | Universal cash deposit | No eligibility bureaucracy |
| Medicaid eligibility determination | Protocol catastrophic insurance layer + personal health wallet | Identity verifies citizenship; catastrophic frontier governs pooled coverage |
| K-12 funding bureaucracy | Per-child education voucher or credit with local top-ups | Money follows the child; states/localities handle delivery |
| Poverty determination bureaucracy | Eliminated | The protocol does not determine desert; it distributes |
| Caseworker-based exception pleading | Published catastrophic frontier + representative-payee rules | The protocol does not fund sympathy contests |
The system currently spends more deciding who deserves help than it would cost to help everyone. The protocol helps everyone. The savings come from firing the decision.
Accountability
The Problem
The Government Accountability Office employs approximately 3,600 staff, spends $812 million per year, and produces reports that arrive months or years after the spending they examine. This is because government financial systems are opaque by design. Tracking money through agencies, contractors, and subcontractors requires human investigators who request documents, interview officials, and reconstruct transaction histories from filing cabinets and incompatible databases.
The results are instructive. The Department of Defense has failed its financial audit every single year since audits became mandatory in 2018. Seven consecutive failures through FY2024. The Pentagon cannot account for where trillions of dollars went. The consequence of seven consecutive audit failures: nothing. No budget cut. No personnel change. No criminal investigation. The GAO identified the problem. Congress received the report. The report went into a filing cabinet. The filing cabinet went into a building. The building is still there. So is the problem.
The Freedom of Information Act is the mechanism by which citizens can see how their money is spent. The average FOIA response time is measured in months; complex requests take years. Some agencies have backlogs exceeding 10,000 requests. The system designed to provide transparency has a waiting list. The concept of a “transparency waiting list” is remarkable. It is like a “visibility queue” at a window factory. The window exists. You are not allowed to look through it yet. Please take a number.
The Protocol
When every government transaction is on a public ledger, auditing is not a function. It is a property.
Every unit spent by any governance function is visible to every citizen in real time. There is no document to request. There is no official to interview. The ledger is the audit. Anyone can verify any public expenditure, trace any allocation from wishocratic preference to final disbursement, and confirm that the protocol executed as specified.
What This Replaces
| Current System | Replacement | Savings |
|---|---|---|
| GAO (~3,600 staff, $812M/year) | Transparent ledger | $812M/year + audit lag eliminated |
| Inspector General offices (per-agency watchdogs) | Redundant; the watched activity is public | Hundreds of millions/year |
| FOIA requests (months-to-years response time) | Unnecessary; spending is public by default | Administrative cost + democratic delay eliminated |
The Pentagon has failed its audit seven years running. A public ledger cannot fail an audit. It is the audit. The distinction is architectural, not aspirational.
Political Incentives
The Problem
Politicians are funded by donors whose interests diverge from citizens’. This is not a theory. It is a business model with documented returns.
$181 billion (95% CI: $150 billion-$220 billion) per year58 in corporate welfare is the direct return on $4.4 billion (95% CI: $3.74 billion-$5.06 billion) per year in lobbying investment. Studies of specific lobbying campaigns have found returns exceeding 22,000%: the American Jobs Creation Act of 2004 provided $62.5 billion in tax breaks to 93 corporations that spent $282.7 million lobbying for it, a return of $220 for every $1 spent. What donors want, they get. What citizens want, they don’t58.
The revolving door completes the circuit. Roughly half of departing members of Congress become lobbyists, monetizing the relationships and access they accumulated in office. The career path is: get elected, learn who controls the money, leave office, sell that knowledge to the people who control the money. The regulator becomes the regulated’s employee. This is not corruption in the legal sense. It is the system working as designed, which is worse, because corruption can be prosecuted and systems cannot.
The Protocol
The Citizen Alignment Score171 measures how closely each politician’s voting record aligns with their constituents’ wishocratic preferences. Campaign funding flows proportionally to alignment: politicians who represent what citizens want receive more electoral resources than politicians who represent what donors want.
The Incentive Alignment Bonds175 fund this mechanism. Bond investors earn returns proportional to treaty expansion and health outcomes; a portion of those returns flows to political incentives that reward alignment.
What This Replaces
| Current System | Replacement | Mechanism |
|---|---|---|
| FEC (regulator of donor-driven system) | Nothing to regulate when there’s nobody to bribe | Structural elimination |
| Campaign finance ($15.9B in 2024 federal elections) | Alignment-proportional funding | Citizens fund representation, not donors |
| Lobbying industry ($4.4 billion (95% CI: $3.74 billion-$5.06 billion)/year) | No intermediary to lobby | Function ceases to exist |
The lobbying industry’s return on investment is extraordinary because the intermediary it purchases is cheap. Remove the intermediary and the investment has no target. You cannot bribe an algorithm. You can try, but the algorithm does not have a post-office career to protect.
Capital Formation and Investor Protection
The Problem
The Securities and Exchange Commission protects investors primarily by deciding who is permitted to invest. Under the accredited-investor rule, you may buy into private companies and the highest-return early-stage deals only if you earn over $200,000 a year ($300,000 with a spouse) or hold over $1 million in net worth excluding your home176. Most households fail that test, and are therefore barred by law from the best-performing asset class. Early-stage and venture investments have returned roughly 17% (95% CI: 13%-22%) a year; the retirement accounts ordinary people are allowed to hold return about 6.5% (95% CI: 5%-8%). The gap is not skill. It is a permission slip.
The thresholds are written in 1982 dollars and have never been indexed177. Inflation has quietly enlarged the excluded class for four decades: a sum that marked the genuinely rich in 1982 now describes a two-income household with a paid-off house, who are nonetheless deemed too unsophisticated to risk their own money.
The stated justification is fraud protection. But a wealth test does not prevent fraud; it decides who is permitted to be defrauded, and who collects the returns. Fraud is already separately illegal: the SEC brought 583 enforcement actions and collected a record $8.2 billion in FY2024 alone178. And the wealth screen fails on its own terms. Every victim of Bernie Madoff’s $64.8 billion Ponzi (the wealthy individuals, the feeder funds, the banks, the university endowments and charities) was accredited179. The rule did not stop the largest investment fraud in history. It pre-screened the victims as qualified.
The wealth proxy is, on inspection, absurd. Net worth measures how much a person can afford to lose, not whether they can evaluate a deal. And the same government that forbids a nurse a $1,000 stake in a startup will happily sell her lottery tickets and sports bets: U.S. commercial gambling took in a record $66.5 billion in 2023180. You may legally gamble your paycheck. You may not legally invest it.
When access has actually been opened, the predicted catastrophe did not arrive. Regulation Crowdfunding, effective 2016, lets non-accredited people invest in startups; through 2024 it channeled roughly $1.3 billion across some 8,500 offerings, and the SEC’s own review found “a low incidence of fraud”181. So the rule’s ledger reads: a small, visible, headline-generating quantity of averted fraud (most of which it does not actually avert), set against an enormous, invisible, permanent cost: most households walled out of the highest returns, with those returns compounding to the already-wealthy by operation of law. It is the same accounting error diagnosed in I Am Retarded: the concentrated, visible harm gets the news story, while the diffuse, uncounted harm (here, the invisible graveyard182 of wealth never built) sets policy by never being seen.
The Protocol
Replace gatekeeping-by-wealth with protection-by-transparency. Three primitives, all properties of the public ledger rather than offices full of reviewers:
- Disclosure by default. Every issuer’s filings, capitalization table, use of funds, and ongoing results are published to the ledger in standardized, machine-readable form. The thing the accredited rule assumes ordinary people cannot obtain (information) is simply made public.
- Algorithmic fraud detection. Pattern analysis runs continuously over the ledger and flags the statistical signatures of fraud (impossible returns, circular flows, undisclosed related-party transfers) in real time, instead of after the collapse and the press conference.
- Access by competence, not wealth. Anyone may invest. A standardized risk disclosure and an optional competence check replace the net-worth test, so the question becomes whether you understand the instrument, not whether you can afford to lose the money.
Investor protection becomes a property of the system (transparency plus detection) instead of a wall built around the people with the least capital and the most to gain.
What This Replaces
| Current System | Replacement | Mechanism |
|---|---|---|
| Accredited-investor wealth gate | Open access + standardized disclosure + competence check | Protect by information, not by exclusion |
| SEC disclosure review (~$2.1-2.4B/year, ~5,000 staff183) | Disclosure-by-default on a public ledger | Filings public and machine-readable by construction |
| Post-hoc fraud enforcement | Continuous algorithmic detection | Fraud flagged as it happens, not litigated after |
The accredited rule protects the public from investing the way a locked library protects the public from misreading. Madoff’s victims all cleared the wealth test; the non-accredited crowd that Regulation Crowdfunding finally let in did not produce a fraud wave. The wall was never the protection. The disclosure was.
Identity and Census
The Problem
The United States Census Bureau spent $14.2 billion on the 2020 census. It counted everyone once. The count took months to process. By publication, it was already out of date. The next count is in 2030.
Every American carries a GPS-enabled device that reports its location continuously to at least three private corporations. Your phone company knows where you are right now. Your search engine knows where you were yesterday. Your social media platform can estimate where you will be tomorrow. The government, which ostensibly needs to know where people are, spends $14.2 billion to find out approximately the same information, once per decade, less accurately, and several months late. In a rational civilization, this would be performance art. On Earth, it is the Census Bureau.
The Protocol
Continuous, sybil-resistant citizen verification through the identity layer. Every verified citizen has exactly one identity on the ledger within the jurisdiction in which they vote and receive distributions. The total count is a view function that returns in milliseconds, updated in real time.
The same identity layer prevents double-counting (census), double-spending (monetary system), and double-voting (wishocratic allocation). One primitive serves three functions.
What This Replaces
| Current System | Replacement | Savings |
|---|---|---|
| Census Bureau ($14.2B per decade) | Continuous real-time count | ~$1.4B/year amortized |
| Voter registration (separate bureaucracy) | Merged into identity layer | Administrative cost eliminated |
| Benefits eligibility verification (per-program) | Unified in identity layer | Redundant systems eliminated |
Where the Money Goes
A reasonable person might ask: if the protocol saves trillions, where is that money currently going? The answer requires distinguishing several categories of loss, because they are different in kind and the savings work differently for each.
Agency Operating Overhead
This is the direct public cost of running intermediary agencies. It is real, it is recoverable, and it is smaller than the value currently diverted by captured policy:
| Agency/System | Annual Admin Cost | Replacement |
|---|---|---|
| Federal Reserve | ~$6.8B operational | Deterministic monetary algorithm |
| IRS (agency operations) | ~$14B | Protocol-level settlement tax |
| SSA + welfare administration (not benefits) | ~$100B across 89 programs | UBI smart contract |
| GAO + IG offices | ~$1B+ | Transparent ledger |
| CBO | ~$60M | Optimocracy engine |
| OMB | ~$143M | Wishocratic eigenvector |
| Census Bureau | ~$1.4B/year amortized | Identity layer |
| Total public operating overhead | ~$123B/year |
Private compliance burn is larger but different in kind. Americans and firms spend $546 billion (95% CI: $450 billion-$650 billion) per year on tax compliance and $580 billion (95% CI: $290 billion-$1 trillion) per year on regulatory red tape. That value returns to households and firms as time back, fees not paid, and lower operating costs. It is real social gain, but it is not a Treasury pool and therefore is not counted in the routable UBI total.
Note what is not in this table: the benefit pools themselves. The conservative floor reported below excludes current welfare benefits to avoid mixing transfer replacement with waste removal. In the cash-maximal workable design, the transfer-like portion of those programs is collapsed into the UBI base rather than preserved as separate bureaucracies. What remains outside raw cash are only the pieces that are not actually transfers: catastrophic risk pooling, child-linked education funding, and incapacity management for citizens who cannot contract on their own behalf. The broader $1.2 trillion (95% CI: $1 trillion-$1.5 trillion) healthcare waste estimated in the US Efficiency Audit is still treated below as lower system cost, not as a fiscal windfall that can simply be deposited as cash.
The bank tollbooth. The US Efficiency Audit totals used in this paper count government waste. They do not include the private tollbooth created by the same monetary architecture. Finance and insurance captured 8% of US GDP in Q3 2025, about $2.3 trillion/year184. In the early 1970s the sector was about 4% of GDP184,185. The cleanest excess estimate is therefore the post-1971 doubling itself: roughly 4% of GDP, or about $1.1 trillion/year, before counting bailout tails, Cantillon gains, and politically protected spreads. That direction matches the micro evidence: Philippon and Reshef find that 30-50% of the finance wage premium is pure rent rather than payment for real complexity185. The full $2.3 trillion/year is the gross ceiling if deposits, payments, settlement, custody, and much of the current money-moving stack migrate to the protocol.
Not every institution currently called a bank disappears. Credit analysis, bankruptcy workouts, and duration matching remain real work. But those functions do not require banks to sit between every citizen and their money. The protocol removes banks as utilities and leaves only competitive lending businesses.
Lobbying-Purchased Policy Waste
The larger savings come not from eliminating agencies but from eliminating the policies those agencies were lobbied into maintaining. These policies persist because an intermediary (a politician, a regulator, a committee chair) was purchased, and the purchaser has a financial interest in the policy’s continuation:
- Corporate welfare: $181 billion (95% CI: $150 billion-$220 billion)/year58 (no intermediary to lobby)
- Agricultural subsidies: $75 billion (95% CI: $50 billion-$120 billion)/year143 (no informed citizen voluntarily pays a farmer to not grow food)
- Fossil fuel subsidies: $50 billion (95% CI: $30 billion-$80 billion)/year145 (citizens do not voluntarily subsidize the industry causing the problem they want solved)
- Drug war: $90 billion (95% CI: $60 billion-$150 billion)/year144 (evidence engine shows negative ROI; citizens reallocate)
- Military overspend: $702 billion (95% CI: $671 billion-$728 billion)/year above a first-principles homeland-defense baseline (citizens allocate defense, not offense)
This money is not “wasted” in the sense of vanishing. It goes to military contractors, agricultural corporations, fossil fuel companies, and the prison-industrial complex. It is extracted from taxpayers and delivered to industries whose lobbying purchased the delivery. Remove the intermediary and the purchase has no seller. Under the protocol’s default fiscal rule, cash that is directly recaptured does not disappear into a lower nominal tax rate or get quietly reabsorbed by agencies. It is swept into the structural dividend and deposited equally as UBI. Visible cash is the default because visible cash is politically durable.
- Tax evasion recovery: The net tax gap is ~$600B/year. The protocol closes most of it through three reinforcing mechanisms. First, underreporting of on-ledger final consumption becomes far harder because settlement and tax collection occur in the same transaction. Second, the incentive to evade collapses: a low single-digit or low-double-digit settlement tax is far less worth evading than a 52% marginal rate (income + payroll combined). Third, UBI is conditional on verified on-ledger identity. Going off-ledger to avoid a small tax means forfeiting a daily cash deposit that often exceeds what you would save. Off-ledger activity (cash labor, barter, foreign settlement) will not disappear entirely, but the incentive structure shrinks it to a fraction of the current gap. Conservative estimate: ~$500B/year recovered.
Structural GDP Recovery
Some waste is not money spent badly but economic activity prevented entirely. The US Efficiency Audit170 estimates $1.56 trillion (95% CI: $1.11 trillion-$2.1 trillion)/year in policy-induced GDP loss recoverable at OECD-median performance:
- Housing supply restrictions cost $1.4 trillion (95% CI: $500 billion-$2 trillion)/year147, because your government made it illegal to build housing where people need it so existing homeowners could watch their property values rise while their children moved back in
- Tariffs cost $160 billion (95% CI: $90 billion-$250 billion)/year148 (citizens taxing themselves for buying things)
No citizen, given the choice and the evidence, allocates funding to “make housing illegal where I need it.” But budget automation alone does not repeal law. The protocol handles that explicitly. When evidence shows that a rule destroys purchasing power or median income, citizens in the relevant jurisdiction vote on the rule directly; where the higher jurisdiction cannot directly repeal a lower-jurisdiction rule, funding flows are conditioned on compliance instead of pretending away federalism. Remove the intermediary from rulemaking as well as budgeting, and the suppressed economic activity resumes. This is not money freed up from a budget. It is economic growth that was being prevented and is no longer.
Where the Savings Flow
The accounting rule is simple. If the protocol directly captures the cash, it becomes UBI by default. If the protocol removes a cost without routing the money through the Treasury, the gain shows up as lower prices, lower fees, less compliance labor, or higher wages. Mixing those categories is how governance papers become sloppy.
| Bucket | Annual value | Per capita | How citizens receive it |
|---|---|---|---|
| Agency operating overhead eliminated | ~$123B/year | ~$370/person | Structural dividend (cash UBI) |
| Direct spending waste reclaimed | $1.1 trillion (95% CI: $1.03 trillion-$1.17 trillion)/year | ~$3,000/person | Structural dividend (cash UBI) |
| Tax gap recovery | ~$500B/year | ~$1,500/person | Structural dividend (cash UBI) |
| Total protocol-routable UBI floor | ~$1.63T/year | ~$4,900/person | Deposited daily as equal cash |
| Compliance burden removed | $1.13 trillion (95% CI: $856 billion-$1.49 trillion)/year | ~$3,400/person | Time back, lower private costs, lower prices |
| Healthcare system waste removed | $1.2 trillion (95% CI: $1 trillion-$1.44 trillion)/year | ~$3,600/person | Lower healthcare prices, premiums, and tax pressure |
| GDP suppression reversed | $1.56 trillion (95% CI: $1.11 trillion-$2.1 trillion)/year | ~$4,700/person | Higher wages, more jobs, larger output |
| Financial intermediation rent removed (defensible excess estimate) | ~$1.1T/year | ~$3,300/person | Lower fees and spreads, lower bailout risk, labor released from arbitrage |
| Total non-UBI societal gain | ~$4.99T/year | ~$14,900/person | Cheaper life rather than a Treasury transfer |
| Combined conservative quantified total | ~$6.62T/year | ~$19,800/person | Cash plus lower costs |
Using the full $2.3T/year finance capture instead of the $1.1T excess estimate raises the combined quantified total to roughly ~$7.82T/year, or about ~$23,400 per person. That is a ceiling, not the central claim.
The paper therefore makes two distinct promises. First, the protocol can plausibly deliver a visible structural dividend of roughly $4,900 per person per year before counting any productivity dividend or optional democratic supplement. Second, it can remove an additional ~$14,900 per person per year in diffuse societal extraction that people experience as cheaper life rather than as a government transfer.
That visible-cash figure is intentionally conservative. It counts waste removal and newly recoverable revenue, not the larger redesign step of collapsing existing transfer programs into the same cash rail. The United States already runs over $1.1 trillion/year in means-tested welfare through 89 federal programs. A maximum-workable UBI design would move the transfer-like portion of that spending into the UBI base, and over time do the same with retirement cash support, while leaving only catastrophic coverage, child-linked education vouchers, and narrow incapacity rules outside the universal cash stream. Those layers are not added to the floor here because existing budget aggregates mix cash transfers with service spending and would otherwise invite double counting.
These numbers should be read as a conservative floor, not as a full automation ceiling. Several plausible gains are intentionally excluded because they are real but not separately modeled cleanly enough yet:
- State and local duplication. The US Efficiency Audit explicitly excludes large parts of state and local administrative waste, even though licensing, permitting, property-tax administration, benefits administration, local compliance, and procurement are full of the same replaceable spreadsheet functions.
- Workflow automation not separately isolated. Grant administration, permit review, customs processing, procurement routing, claims handling, prior authorization, and other queue-based bureaucratic workflows are partly reflected inside broader categories like regulatory red tape, healthcare inefficiency, or military overspend, but are not broken out as standalone additions in this paper.
- Campaign-finance and lobbying overhead itself. The protocol removes much of the machinery that makes donor capture profitable, but the paper counts the resulting bad allocations, not the full standalone cost of the political compliance industry that services them.
If those layers were separately measured and added without overlap, the upside would be higher. They are left out here because a defensible floor is more useful than an inflated ceiling.
The adoption mechanism (how the protocol passes despite intermediary resistance) is funded through Incentive Alignment Bonds175, which align investor, politician, and citizen incentives. The financial architecture of adoption, including the bond structure, revenue splits, and political incentive mechanics, is specified in that paper. This paper describes what the protocol does. The IAB paper describes how it gets adopted.
Wishocracy governs the ordinary discretionary budget (the existing $6.8T in federal spending), not the protocol-captured savings stream. The protocol-captured savings flow to citizens by default as UBI. The ordinary budget is where citizens express preferences on cancer research vs. infrastructure vs. defense and other true public goods, while citizen rule votes govern legal changes that are not reducible to budget lines. The federal role is to finance the floor; states and localities should handle most service delivery and can top up the federal floor rather than recreate it.
The total is not double-counted. The US Efficiency Audit170 contributes four categories to the $4.9T base arithmetic: direct spending waste, compliance burden, policy-induced GDP loss, and system inefficiency. This paper then treats agency operating overhead, tax-gap recovery, and financial intermediation rent as adjacent categories outside that $4.9T base so that public waste, private toll extraction, and newly recoverable revenue are not blurred together.
What the Dividend Looks Like
Abstract trillions are difficult to feel. A structural dividend of ~$1.63T/year is not. That is roughly $4,900 per person per year, about $400/month per citizen, or roughly $19,500 per year for a family of four, before the productivity dividend and before any optional democratic supplement. Deposited daily, it is an always-visible reminder that the money used to go to intermediaries and now goes to citizens.
The rest of the gain is not imaginary or secondary. It simply arrives in a different form. The conservative non-UBI stack, roughly $14,900 per person per year, shows up as cheaper housing, cheaper healthcare, lower bank spreads, lower transaction fees, less filing labor, and higher wages from output that is no longer being suppressed. The protocol therefore improves household finances from both sides: more money in, less money stolen.
The current system cannot do this. Not because the money does not exist, but because the intermediaries who control it have no incentive to allocate it this way. The lobbying industry does not represent hungry children. Malaria does not have a Super PAC. Clean water does not make campaign contributions. The allocation reflects who has access to the intermediary, not who has the greatest need. Remove the intermediary, and the math changes. Not because citizens are saints. Because citizens, unlike intermediaries, are also the beneficiaries.
Implementation Pathway
The protocol cannot be deployed simultaneously. Each primitive has prerequisites, and trust must be earned, not assumed.
Phase 0: Evidence layer (deploy now). The Optimocracy engine173 and Optimal Budget Generator186 require no legislative change. They compare existing policy outcomes across jurisdictions and publish findings. This is research, not governance. Deployment: immediate.
Phase 1: Preference aggregation (deploy with treaty). The 1% Treaty187 172 creates the first pool of wishocratically allocated funds. Citizens allocate $27.2 billion/year via pairwise comparison. One funding stream, one mechanism, outcomes measured by the evidence layer. Deployment: concurrent with treaty ratification.
Phase 2: Transparency layer (Years 1-3). Treaty funds flow through a public ledger. Every allocation from wishocratic preference to final expenditure is visible. This demonstrates the accountability model at limited scale before extending it.
Phase 3: Identity and distribution (Years 3-7). The identity layer and UBI distribution require the largest infrastructure investment. India enrolled 1.4 billion people in Aadhaar using a camera, a fingerprint scanner, and the radical assumption that the government should know who lives there. Estonia runs an entire government digitally. The engineering works at national scale. Global scale requires coordination between national systems, not invention of new technology. Multiple approaches (biometric, social graph, zero-knowledge proof) are in production today.
Phase 4: Revenue and monetary policy (Years 7-15). Replacing the tax system and monetary policy requires the most political capital and the highest confidence in the protocol’s reliability. Deployed last, after Phases 0-3 have demonstrated the model at increasing scale.
Each phase is a test. If citizens allocate treaty funds better than committees do (Phase 1), the argument for letting them allocate domestic budgets gets harder to ignore. If the transparent ledger eliminates corruption in treaty spending (Phase 2), the argument for extending it to all government spending gets harder to ignore. The protocol earns trust by performing, not by promising.
Political Economy of Adoption
The protocol proposes to eliminate intermediaries. The intermediaries will not vote for their own elimination. This is not a flaw in the analysis. It is the central political problem, and ignoring it would make the paper useless.
The adoption pathway does not run through policymakers. It runs through citizens, who then apply pressure that policymakers cannot resist. The mechanism is the same one that passes the 1% Treaty172, funded through Incentive Alignment Bonds175 that align investor, politician, and citizen incentives through self-interest rather than altruism. The full financial architecture of adoption is specified in the IAB paper.
The citizen pitch is one sentence: “Your family loses roughly $79,000 per year to intermediation and financial tolls on the conservative numbers. This protocol gives you about $19,500 of that back as visible cash and the rest as lower prices, lower fees, and higher wages. Politicians oppose it because they are the intermediaries.”
That last sentence is the key. It reframes every objection as self-interested confirmation of the thesis. A politician who argues against the protocol is arguing for the system that costs each family roughly $79,000 on the conservative numbers. The argument against adoption is the argument for adoption.
Three incentive layers make adoption self-reinforcing:
Citizens want cash. Nobody needs to understand RAPPA or eigenvectors to understand “money in your account every morning.” Email adoption did not require understanding SMTP. The web did not require understanding TCP/IP. The governance improvements are infrastructure the user never sees. The cash is the product.
Investors want returns. The IABs make the protocol’s adoption and expansion directly profitable for bondholders, turning every investor into a permanent lobbyist. The greedier the investor, the harder they lobby.
Politicians want funding. The Citizen Alignment Score171 and IAB-funded political incentives make supporting the protocol more financially rewarding than opposing it. Politicians follow the money. They always do. The protocol redirects where the money points.
The result is a system where every participant acts selfishly and the protocol gets adopted anyway. This is not idealism. It is the same trick your species already uses for everything else. You call it “the market.” The same species that invented lobbying can be out-lobbied.
Objections
“You can’t replace human judgment with algorithms”
We are not replacing judgment. We are replacing arithmetic. The IRS does not exercise judgment when it calculates your tax liability. It executes a formula. The SSA does not exercise judgment when it computes your benefit amount. It applies a table. The Census Bureau does not exercise judgment when it counts people. It counts them. We propose that the formula execute itself, the table apply itself, and the count count itself. The functions that require actual judgment (criminal sentencing, disability determination, asylum adjudication) remain human. We are replacing the spreadsheet, not the courtroom.
“Citizens are too uninformed to allocate budgets”
The current alternative is not “informed experts.” It is donors who purchased outcomes. The median member of Congress spends 30 hours per week fundraising. The 275 CBO analysts who score legislation are not the ones making allocation decisions; 535 politicians receiving $4.4 billion (95% CI: $3.74 billion-$5.06 billion) per year in lobbying pressure are.
Participatory budgeting has been tested. Porto Alegre, Brazil ran citizen-directed budgeting starting in 1989. Child mortality fell nearly 20% across Brazilian municipalities that adopted it. The share of households with water and sewer access in Porto Alegre rose from 75% to 98%. Citizens, given direct allocation power, funded infrastructure and healthcare. Politicians, given the same money, had funded stadiums and highways. The experiment was not ambiguous. Citizens allocated better on the metrics that matter to citizens. This should not be surprising. It would be surprising if it were otherwise.
“This is techno-utopianism”
The dishwasher replaced dishwashing. The ATM replaced the bank teller line. The spreadsheet replaced 400,000 bookkeepers. None of these were utopianism. All of them were obviously better at the specific function they replaced. The claim is not “algorithms will solve governance.” The claim is “algorithms will solve the specific functions that are already algorithmic but are being executed by millions of expensive, lobbyable humans.” This is the same category of claim as “dishwashers will solve dishes.” It is not ambitious. It is pedestrian.
“The transition would be chaotic”
The status quo is chaotic. Your government shuts down when 535 people cannot agree on a spreadsheet. Your tax system requires 6.1 billion hours of annual compliance labor. Your welfare system makes people wait months for benefits they need immediately. Your accountability system takes 18 months to audit spending that happened in real time. The protocol described in this paper is not a leap from order to chaos. It is a leap from expensive chaos to cheaper order.
The phased implementation ensures that each component demonstrates value before the next is deployed. Phase 1 allocates treaty funds only. If it fails, the cost is 1% of military spending, which is less than most militaries lose to procurement waste annually. If it succeeds, Phase 2 extends the model. At no point is the existing system retired before the replacement has proven itself.
“What about privacy?”
Government spending should be public by default. It is your money. The current system inverts this: your personal data is harvested and sold by private companies, while government spending is hidden behind FOIA requests that take months to years. The protocol reverses it. Government transactions are public. Private consumer settlements reveal only the minimum fields needed for tax collection and macro accounting: amount, standardized category, jurisdiction, and time bucket. Identities, counterparties, and item-level receipts remain private and are validated with zero-knowledge proofs. You can see where every tax dollar goes. Nobody can see what you bought for lunch. This is the correct configuration. Yours is backwards.
Limitations
What Cannot Be Replaced
The protocol replaces mechanical functions. It does not replace:
- Enforcement. Algorithms cannot arrest people, conduct investigations, or exercise prosecutorial discretion. Police, courts, and prisons require human judgment (and reform, but that is a different paper).
- Diplomacy. International negotiation requires relationship-building, cultural understanding, and strategic ambiguity. Algorithms are bad at ambiguity by design.
- Adjudication. Judges interpret law in context. Edge cases require judgment that algorithms cannot reliably provide.
- Emergency response. Disasters require adaptive decision-making under uncertainty. Algorithms optimize logistics; humans decide priorities when assumptions break.
We do not claim this protocol solves governance. We claim it solves the spreadsheet. The spreadsheet is the part you are paying $4.98 trillion (95% CI: $4.39 trillion-$5.61 trillion) per year for.
Failure Modes
Algorithmic capture. If the algorithm’s parameters can be influenced by concentrated interests, the intermediary problem returns in different form. Mitigation: minimize the number of tunable knobs. Tax base, wallet classes, basket definition, update schedule, and vote thresholds are public constitutional parameters; changes require supermajority wishocratic approval, and the evidence engine independently verifies outcomes.
Identity attacks. If sybil-resistance fails, the entire system (UBI, voting weight, census) is compromised. This is the single highest-risk component, and also the one your species is worst at. You still cannot agree on what counts as an ID.
Goodhart’s Law. Optimizing for measurable metrics (median income, HALE) may degrade unmeasured outcomes. Mitigation: the evidence engine continuously expands its measurement set, and citizens can wishocratically fund measurement of outcomes they care about.
Transition disruption. The protocol displaces workers. This deserves honest arithmetic, not hand-waving.
The targeted agencies employ approximately 195,000 permanent staff (IRS ~100,000; SSA ~60,000; Federal Reserve ~24,000; Census Bureau ~4,000; GAO ~3,600; CBO, OMB, FEC ~1,100). Not all roles are mechanical; enforcement, IT transition, judgment-based functions, and oversight of the new systems remain human. Approximately 60-70% of roles in targeted agencies perform the deterministic functions the protocol replaces. That is roughly 115,000-135,000 displaced workers. For context, more Americans lost their jobs to the spreadsheet than would lose their jobs to this protocol. The spreadsheet did not offer a transition fund. The protocol does.
Average federal employee total compensation (salary plus benefits) is approximately $130,000 per year. The cost of paying every displaced worker their full compensation for one year while they retrain or find new employment:
~$15-18 billion. One year of full pay for every displaced worker.
Annual conservative quantified gain from the protocol: roughly ~$6.62T/year, of which ~$1.63T/year is directly routable cash and the rest arrives as lower prices, lower fees, and higher output.
The transition cost is roughly 1% of the direct cash floor and less than 0.3% of the full conservative quantified gain. You could pay every displaced worker for ten years of full salary and still retain the overwhelming majority of the annual benefit. The transition fund could also include retraining programs, early retirement packages for workers near retirement age, and priority placement in the human-judgment roles that remain (enforcement, oversight, adjudication). The total transition package, even if made extravagantly generous, would be a rounding error on the savings.
The political barrier is real: the people whose jobs are replaced by the protocol are the same people currently responsible for approving the protocol. This is not a novel problem (the horse industry opposed the automobile, the telegram industry opposed the telephone, bookkeepers opposed the spreadsheet). In each case, the transition cost was real and the displaced workers deserved support. In no case was the correct response “keep the horses.” The protocol’s phased implementation means displacement is gradual, not overnight, and the savings fund the transition before full deployment.
What We Do Not Know
The protocol assumes that citizen preferences, informed by evidence, produce better resource allocation than expert committees captured by donors. The evidence so far (participatory budgeting, Switzerland’s direct democracy, Estonia’s digital governance) is encouraging but has not been tested at this scale. The phased implementation is designed to generate this evidence incrementally, at bounded cost, before full deployment.
Conclusion
Government is expensive because it is intermediated. Every layer between citizen preference and public outcome extracts value and introduces distortion. The US Efficiency Audit alone identifies $4.98 trillion (95% CI: $4.39 trillion-$5.61 trillion) per year in intermediation waste. Once recovered tax gap and excess financial intermediation rent are included, the conservative quantified stack in this paper rises to roughly ~$6.62T/year.
This protocol does not replace governance. It replaces the mechanical functions that governance currently delegates to humans at extraordinary cost: calculating taxes, distributing benefits, allocating budgets, auditing expenditures, counting citizens, and managing the money supply. These functions are algorithmic in nature. Making them actual algorithms eliminates the intermediary cost while preserving (and expanding) democratic control over what those algorithms do.
The 1% Treaty172 provides both the funding mechanism and the initial deployment surface. Treaty funds, allocated wishocratically and tracked on a public ledger, serve as a bounded pilot. Success at treaty scale builds the evidence and political capital for expansion. Failure at treaty scale costs 1% of military spending, which is less than most militaries lose to administrative overhead annually.
The protocol exists to be forked and improved. The implementation described here is almost certainly wrong in important ways. What is not wrong is the observation that paying millions of humans to execute deterministic functions is an expensive way to avoid writing the code.