1
people have died from curable diseases
since this page started loading...
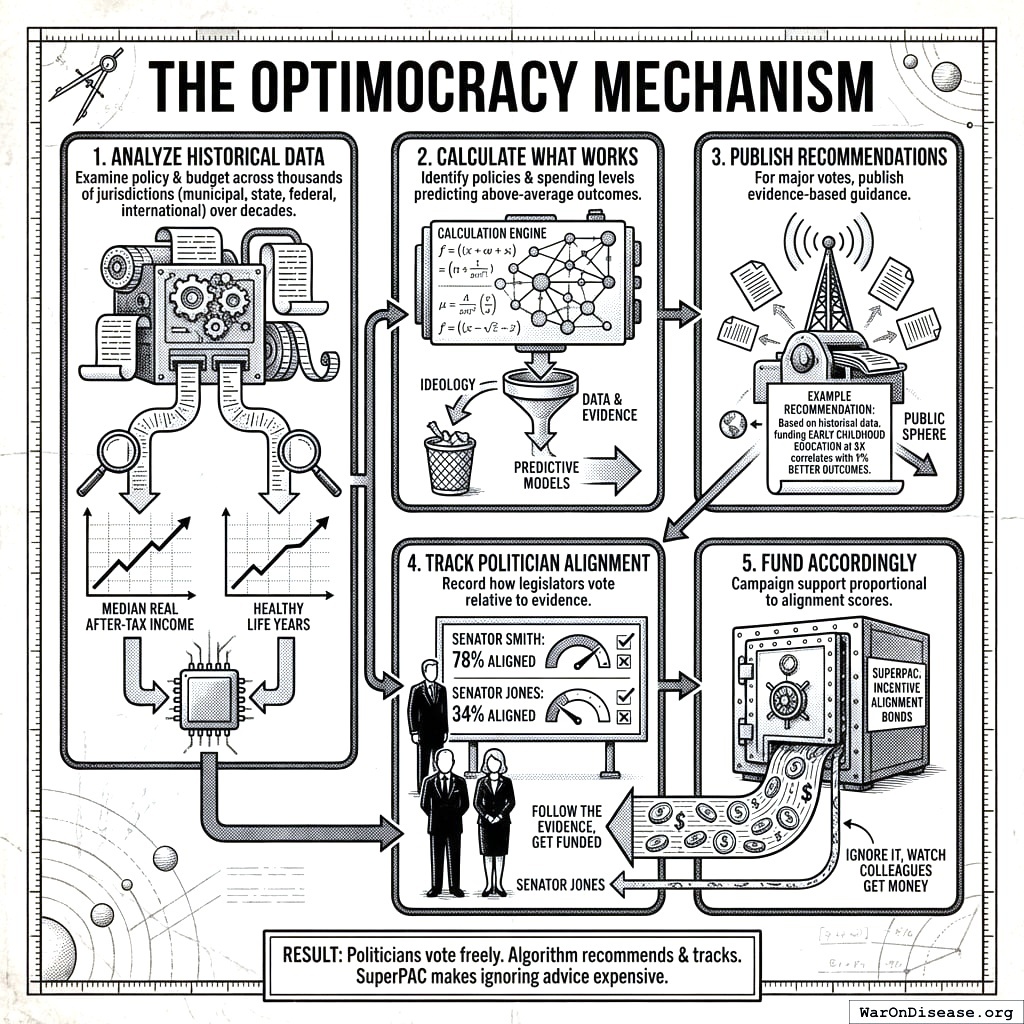
The Mechanism
Optimocracy is simple:
- Exploit cross-jurisdictional variation as natural experiments: Thousands of jurisdictions have made different policy and budget choices over decades. When Kansas cuts education funding and Minnesota increases it, that’s a natural experiment. Apply causal inference methods (synthetic control, difference-in-differences, regression discontinuity) to estimate what happened to median real after-tax income and healthy life years.
Identify which policies predict above-average outcomes: Not ideology. Not theory. Which specific policy choices, across hundreds of jurisdictions and decades of data, causally predicted higher median income and more healthy life years?
Publish recommendations: For every major vote, publish what the evidence suggests. “Based on historical data, funding early childhood education at $X correlates with Y% better outcomes.”
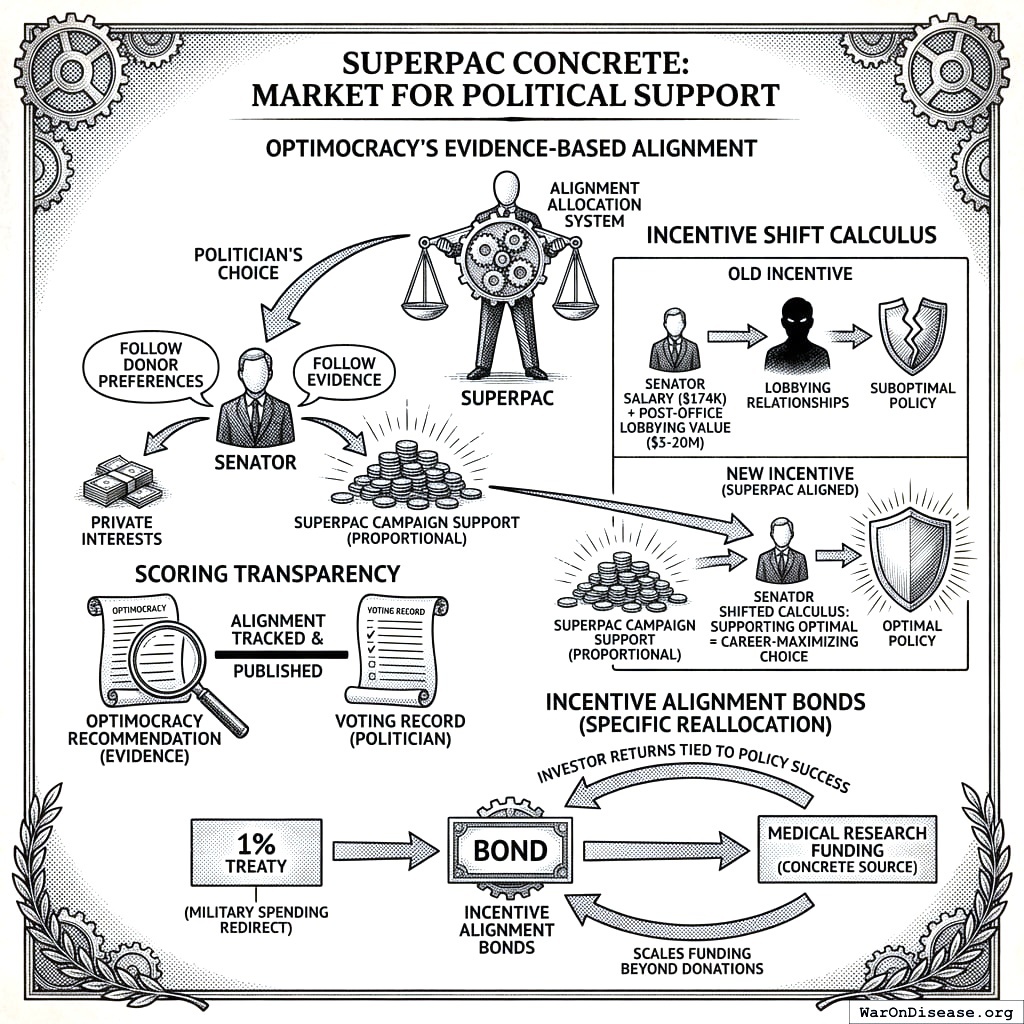
Track politician alignment: When legislators vote, record how often they align with evidence-based recommendations. Senator Smith: 78% aligned. Senator Jones: 34% aligned.
Fund accordingly: A SuperPAC allocates campaign support to maximize expected governance improvement. The algorithm weighs alignment differences between candidates, position power, race competitiveness, and marginal funding effectiveness. Close races with large alignment gaps get priority. Follow evidence, get funded. Ignore it, and resources flow to races where they matter more.
That’s it. Politicians still vote however they want. The algorithm just recommends and tracks. The SuperPAC makes ignoring good advice expensive.
Optimocracy has two distinct components: an analytical engine (causal inference on cross-jurisdictional data to identify what works) and an incentive mechanism (SuperPAC funding to make politicians act on it). The analytical engine is useless without incentives to follow its recommendations. The incentive mechanism is useless without rigorous evidence to base recommendations on. Together, they close the loop between knowing what works and doing what works.
Why This Works
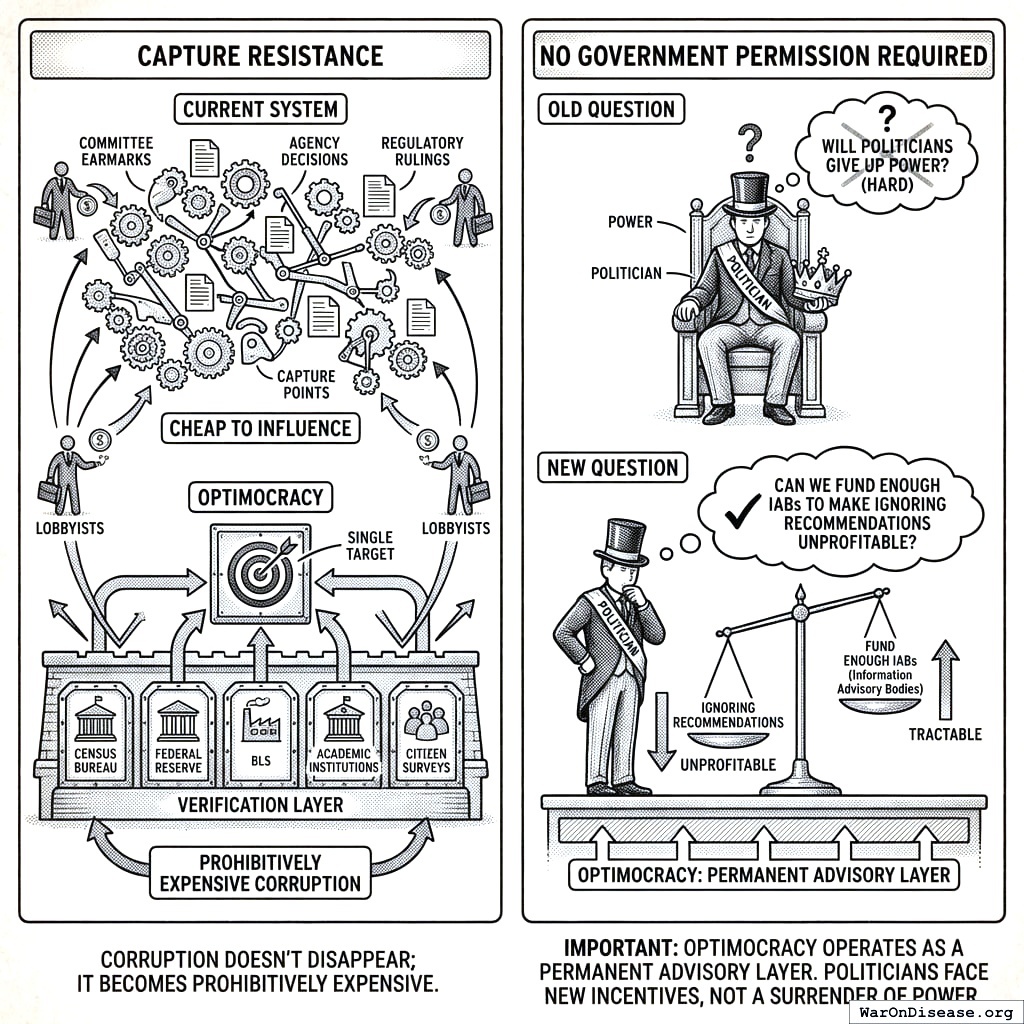
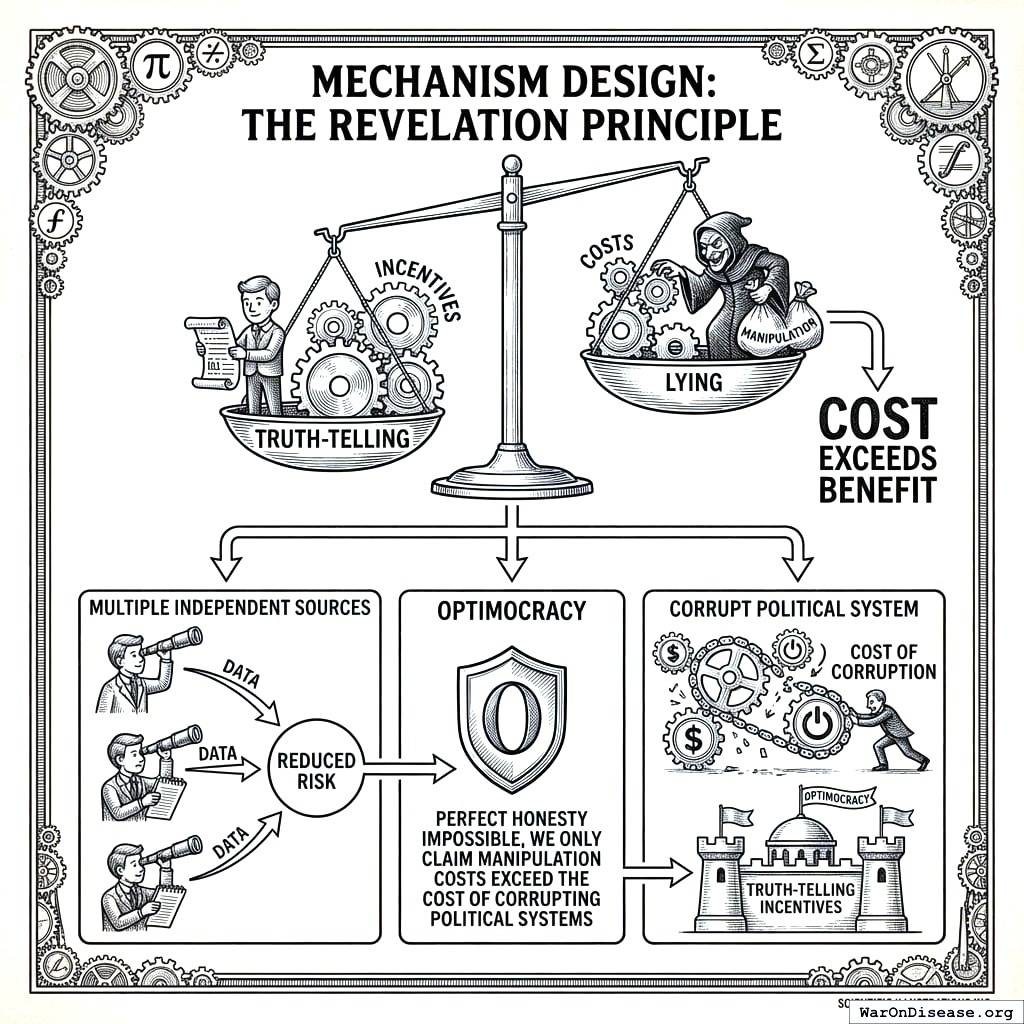
Capture resistance: Currently, lobbyists have thousands of capture points: committee earmarks, agency decisions, regulatory rulings. Each is relatively cheap to influence. Optimocracy consolidates these to a single target: the verification layer measuring health and wealth. Corrupting five independent data sources (Census Bureau, Federal Reserve, BLS, academic institutions, citizen surveys) requires coordination across institutions with different governance structures, funding sources, and methodologies. Corruption doesn’t disappear; it just becomes prohibitively expensive.
Analytical validity: Cross-jurisdictional variation provides the statistical power that single-jurisdiction studies lack. When 50 states adopt different minimum wages over 30 years, we don’t need a randomized trial; we have thousands of natural experiments. Modern causal inference methods (synthetic control, difference-in-differences) can extract signal from this variation. The approach has already produced actionable findings in economics and public health; Optimocracy systematizes it across all policy domains simultaneously.
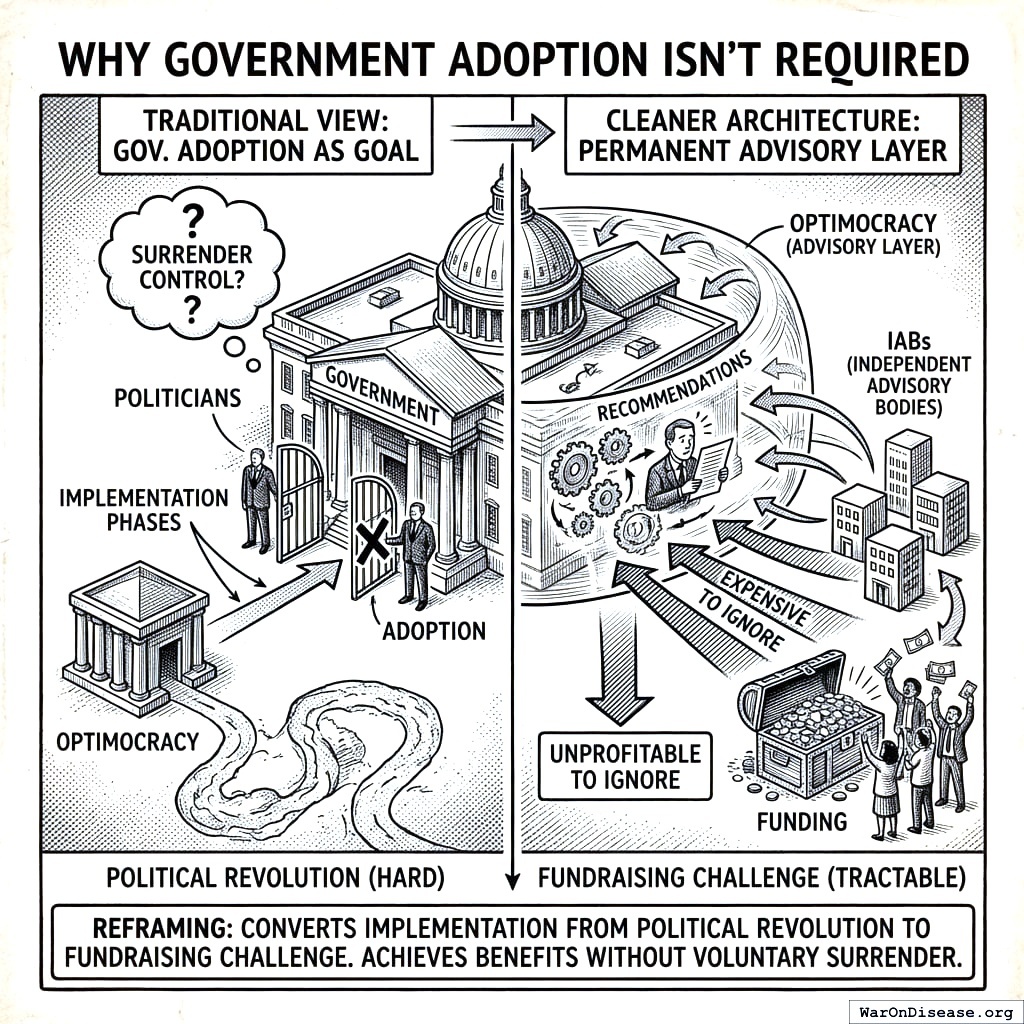
No government permission required: Optimocracy operates as a permanent advisory layer. Politicians don’t surrender power; they just face new incentives. The question changes from “Will politicians give up power?” (hard) to “Can we fund enough Incentive Alignment Bonds (IABs) to make ignoring recommendations unprofitable?” (tractable).
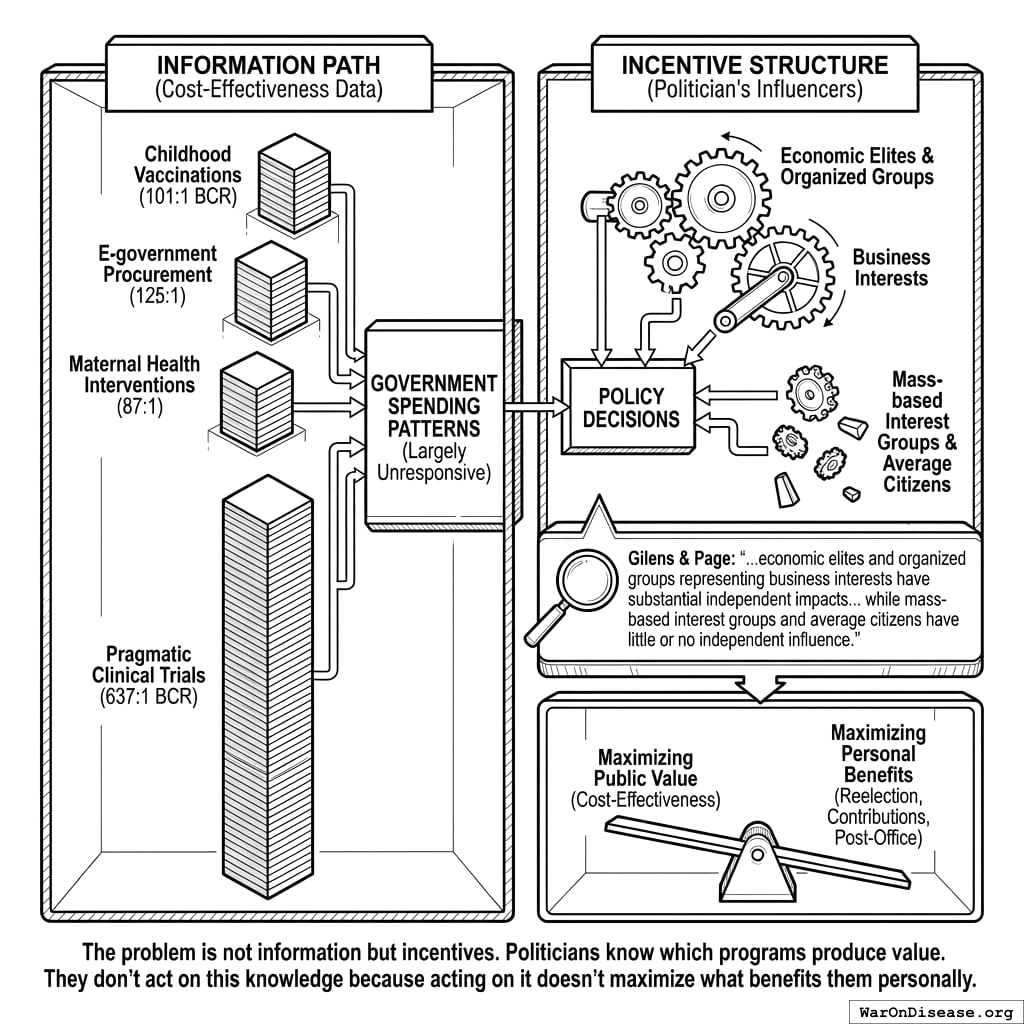
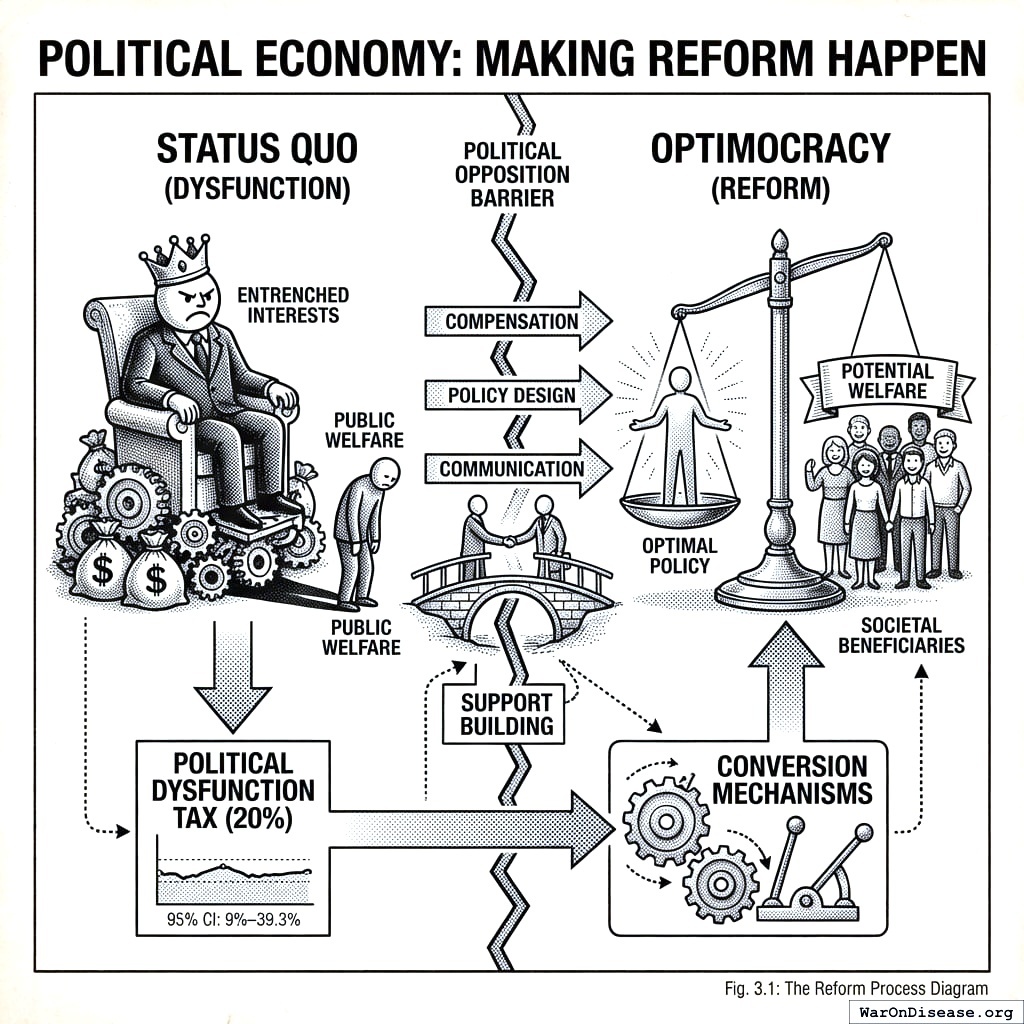
The Problem: Political Dysfunction Tax
Political actors optimize for what gets them reelected: campaign contributions, constituent services, ideological positioning. These differ systematically from what improves measured outcomes. The result: systematic resource misallocation costing $4.9T (95% CI: $3.62T-$6.5T) in documented US waste and $101T (95% CI: $83.3T-$191T) in global opportunity costs. For full derivation, see The Political Dysfunction Tax.
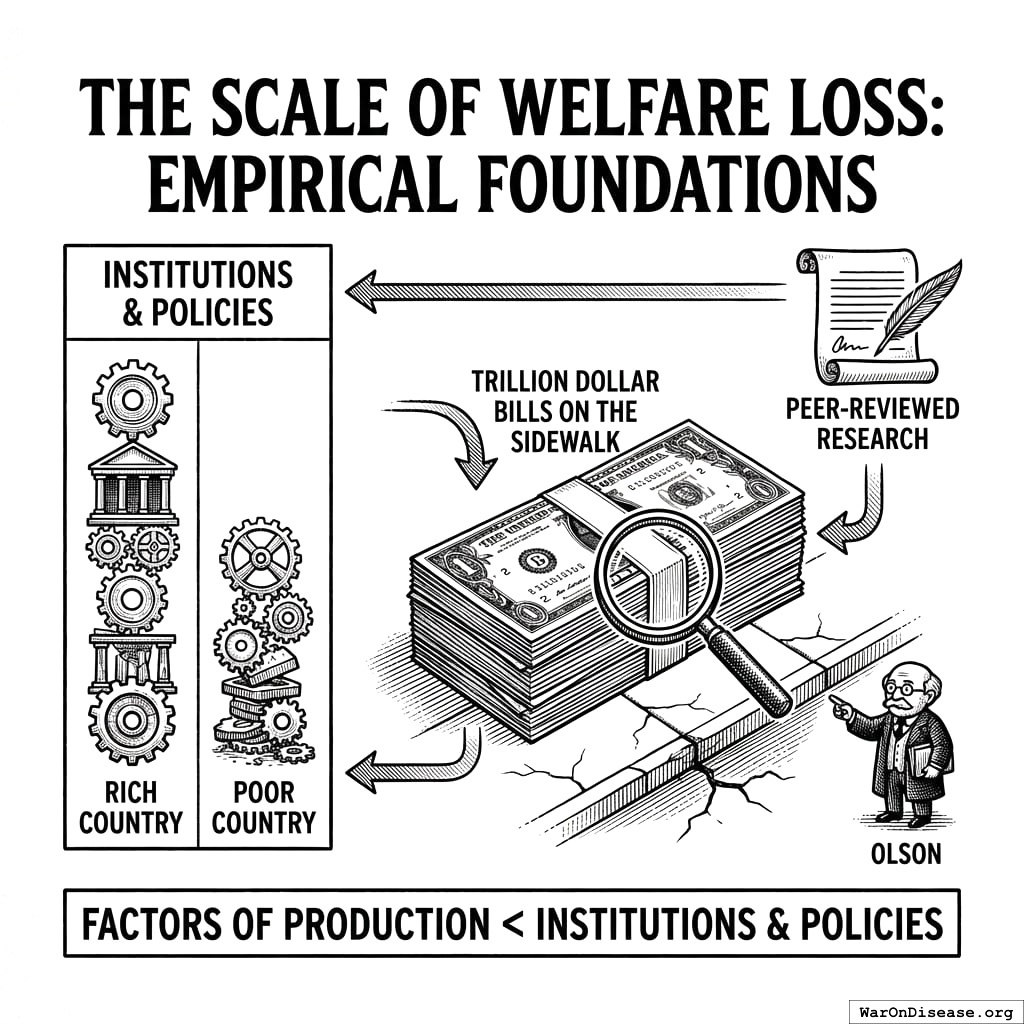
The Scale of Welfare Loss: Empirical Foundations
Before proposing solutions, we must establish the magnitude of the problem. This section synthesizes peer-reviewed research documenting welfare losses from suboptimal policy. The metaphor “trillion dollar bills on the sidewalk” comes from134, who showed that differences between rich and poor countries are primarily due to institutions and policies, not factors of production.
Quantifying the Political Dysfunction Tax
Let \(W^*\) represent maximum achievable welfare under optimal policy, and \(W\) represent actual welfare under current policy. We define the Political Dysfunction Tax as:
\[
\tau_{dysfunction} = \frac{W^* - W}{W^*} = 1 - \frac{W}{W^*}
\]
We estimate this tax through forensic accounting of documented policy failures. The methodology and sources are detailed in The Political Dysfunction Tax. The damage report:
The welfare loss can be conceptually decomposed into sources:
- Crony Tax (\(\tau_{crony}\)): Resources flowing to concentrated interests rather than outcome-maximizing alternatives. Del Rosal135 surveys empirical estimates ranging 0.2% to 23.7% of GDP.
- Short-Termism Cost (\(\tau_{time}\)): Politicians facing re-election in 4 years systematically underinvest in goods that pay off over 10-30 years: basic research, infrastructure maintenance, pandemic preparedness, climate mitigation.
- Ignorance Cost (\(\tau_{information}\)): Decision-makers lacking dispersed local knowledge that markets aggregate136.
- Gridlock Cost (\(\tau_{coordination}\)): Diffuse beneficiaries cannot organize against concentrated interests134.
Optimocracy primarily addresses \(\tau_{crony}\) and \(\tau_{time}\) by making evidence-based recommendations public and rewarding politicians (via campaign support and career opportunities) in proportion to their alignment with those recommendations.
Documented Welfare Losses by Policy Domain
The following table synthesizes estimates from peer-reviewed research:
| US regulatory accumulation (1980-2012) |
137 |
Counterfactual growth trajectory |
25% of GDP ($4T annually) |
Low† |
| US regulation (1949-2005) |
138 |
Panel regression, regulatory index |
GDP would be 3.5x higher |
Low† |
| Global corruption |
139 |
Multiple estimation approaches |
5% of GDP (~$5T/year) |
Medium |
| FDA drug delays (1960-2001) |
140 |
Consumer/producer surplus |
140M life-years lost |
Medium |
| Trade barriers |
141 |
Gravity models |
5-10% of GDP |
High |
| Occupational licensing |
142 |
Labor market distortion |
2-3% of GDP |
High |
†Think tank source with weak causal identification; achievable gains likely smaller.
Note on interpretation: These estimates are not additive; many inefficiencies interact and overlap. However, even conservative aggregation suggests the Political Dysfunction Tax amounts to 17% (95% CI: 12.6%-22.6%) of US GDP in documented waste.
This pattern (massive welfare losses persisting due to political economy constraints) recurs across policy domains. The question is not whether trillion-dollar bills exist, but why they remain on the sidewalk.
Calibrating the estimates: These theoretical maxima require heroic assumptions. Regulatory estimates from think tanks use weak causal identification; 5-10% is more defensible than 25%. After adjusting:
- Regulatory reform: 5-10% of GDP (not 25%)
- Corruption reduction: 3-5% of GDP
- Other allocative improvements: 5-10% of GDP
Conservative aggregate: 17% (95% CI: 12.6%-22.6%) of US GDP in documented waste ($4.9T (95% CI: $3.62T-$6.5T)), with global opportunity costs reaching $101T (95% CI: $83.3T-$191T). This is sufficient to motivate Optimocracy, without relying on heroic assumptions.
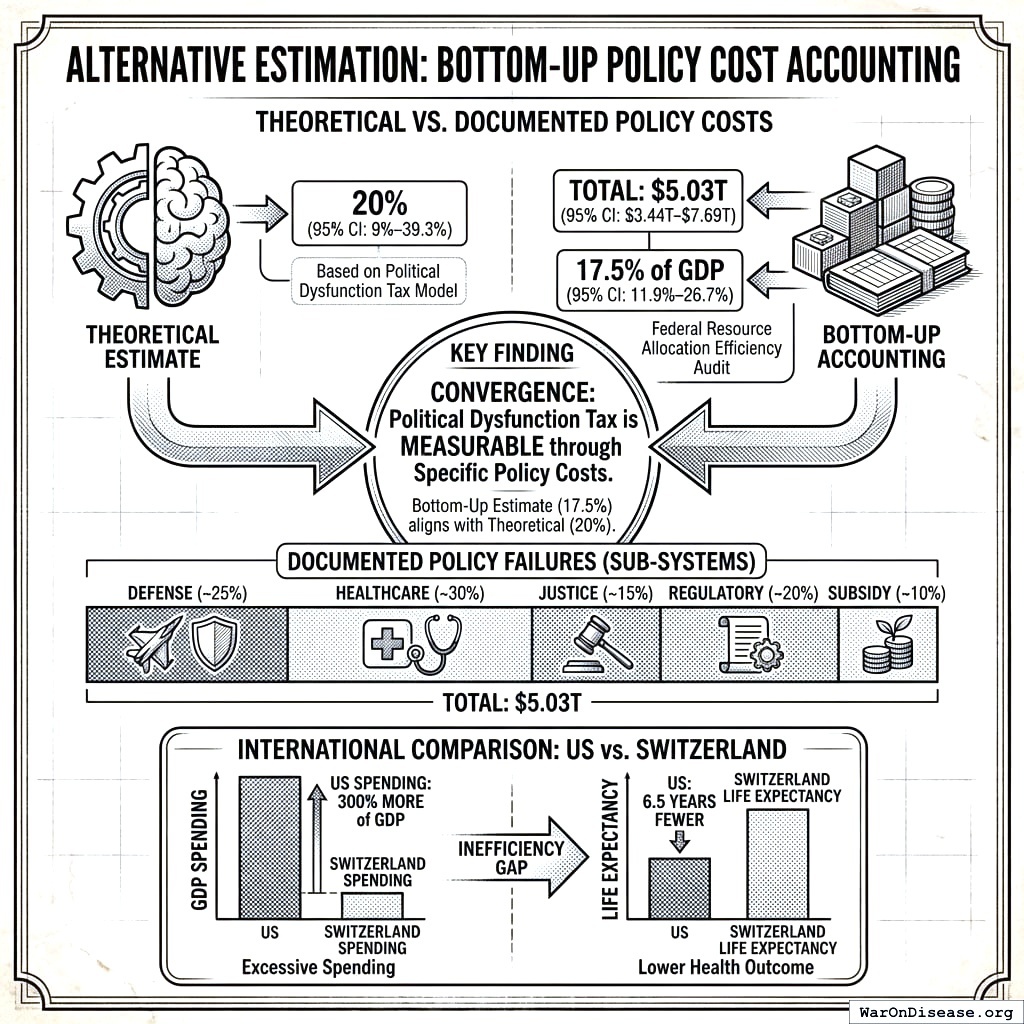
Bottom-Up Policy Cost Accounting
The US government waste estimate of $4.9T (95% CI: $3.62T-$6.5T) (17% (95% CI: 12.6%-22.6%) of GDP) is derived from the United States Efficiency Audit, which enumerates specific, measurable policy failures across defense, healthcare, justice, regulatory, and subsidy subsystems.
International comparisons reinforce this estimate: the US spends 300% percentage points MORE of GDP than Switzerland yet achieves 6.5 years FEWER years of life expectancy.
Implications for Mechanism Design
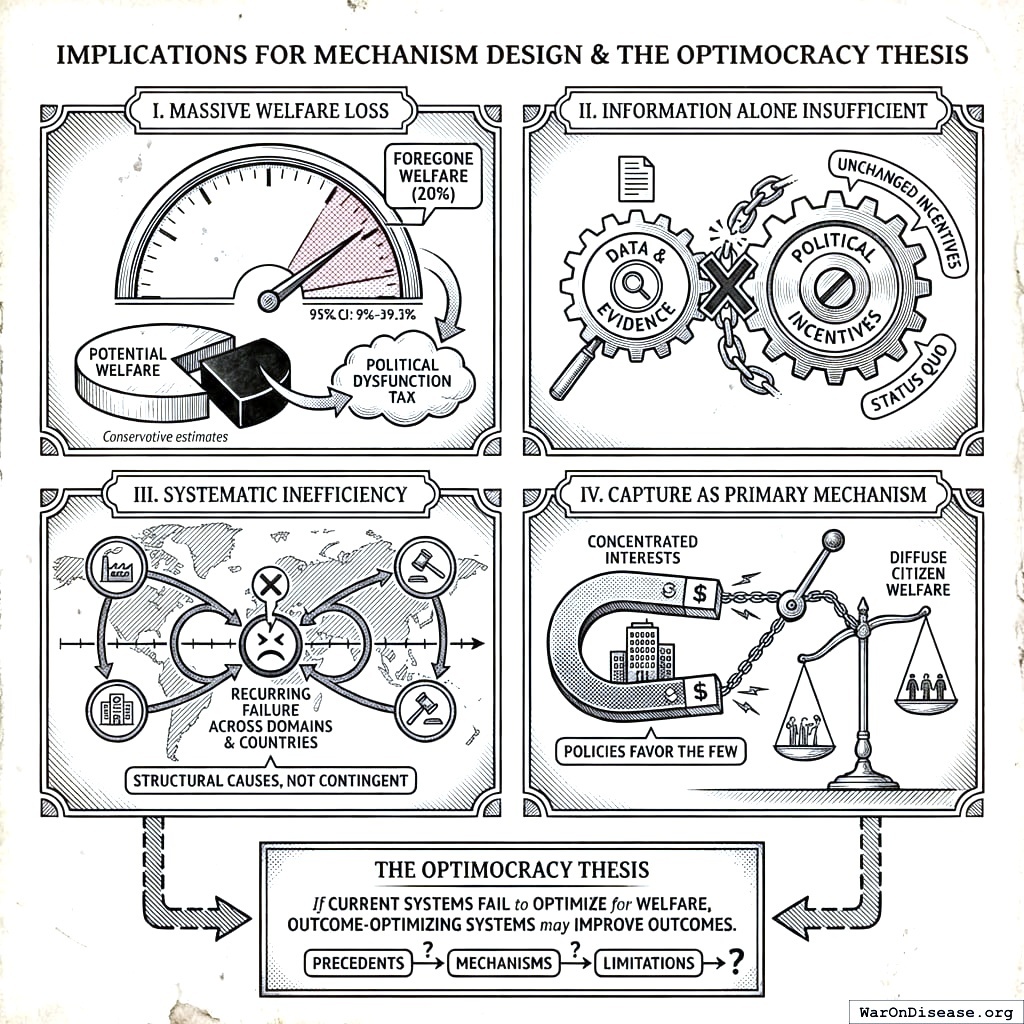
The empirical evidence suggests:
- The welfare loss is massive: Documented US waste alone totals $4.9T (95% CI: $3.62T-$6.5T) (17% (95% CI: 12.6%-22.6%) of GDP).
- Information alone is insufficient: Better data does not change political incentives.
- The inefficiency is systematic: It recurs across domains and countries, suggesting structural rather than contingent causes.
- Capture is the primary mechanism: Policies systematically favor concentrated interests over diffuse citizen welfare.
This motivates the Optimocracy thesis: if current systems systematically fail to optimize for welfare, outcome-optimizing systems may improve outcomes. The following sections examine precedents, mechanisms, and limitations.
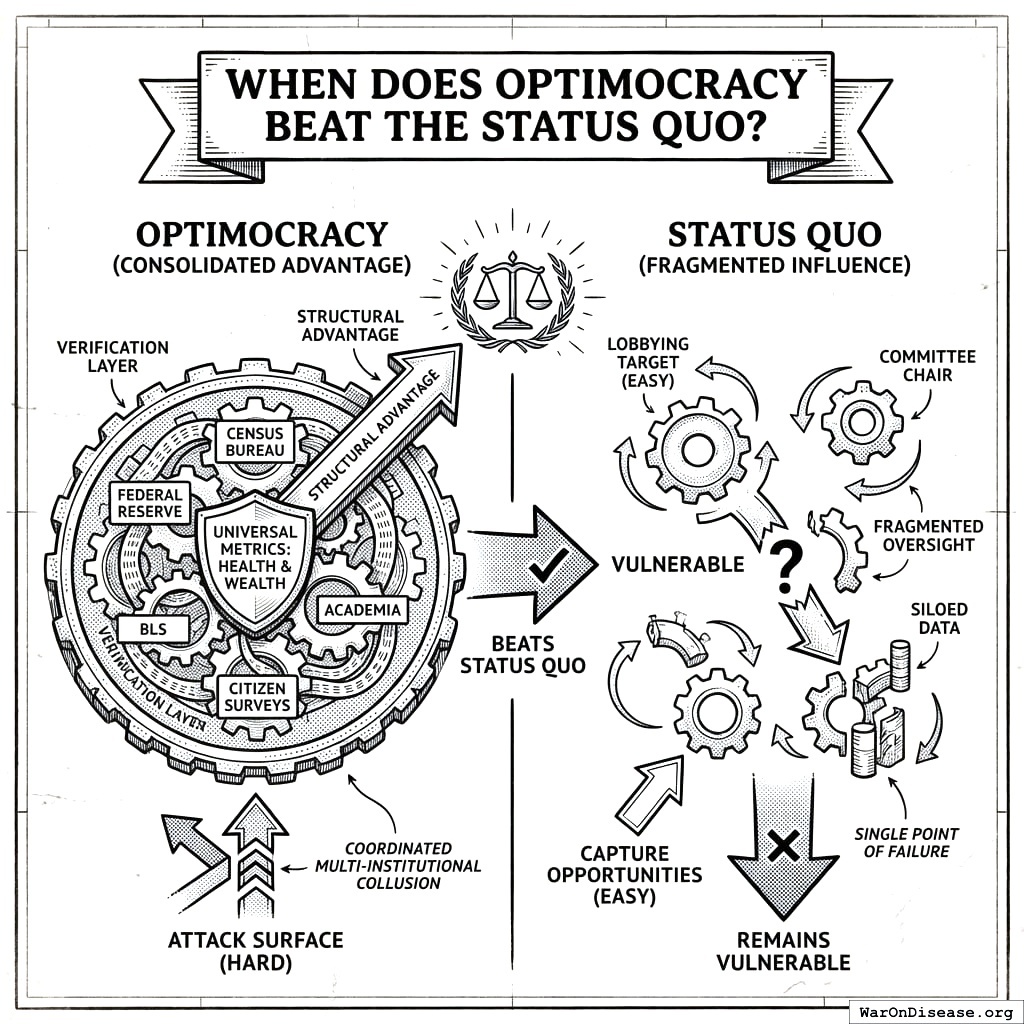
When Does Optimocracy Beat the Status Quo?
Optimocracy’s structural advantage comes from consolidating capture opportunities. The only attack surface is the verification layer itself: coordinating multiple independent institutions to misreport the same metrics, without detection.
Health and wealth are not arbitrary metrics. They are what humans universally value. The challenge for would-be corruptors: coordinate the Census Bureau, Federal Reserve, BLS, academic researchers, and citizen surveys to all report the same biased figure, without any whistleblowers. These institutions have different governance structures, funding sources, and methodologies. Collusion among strangers who lose credibility if caught is fundamentally harder than lobbying a single committee chair.
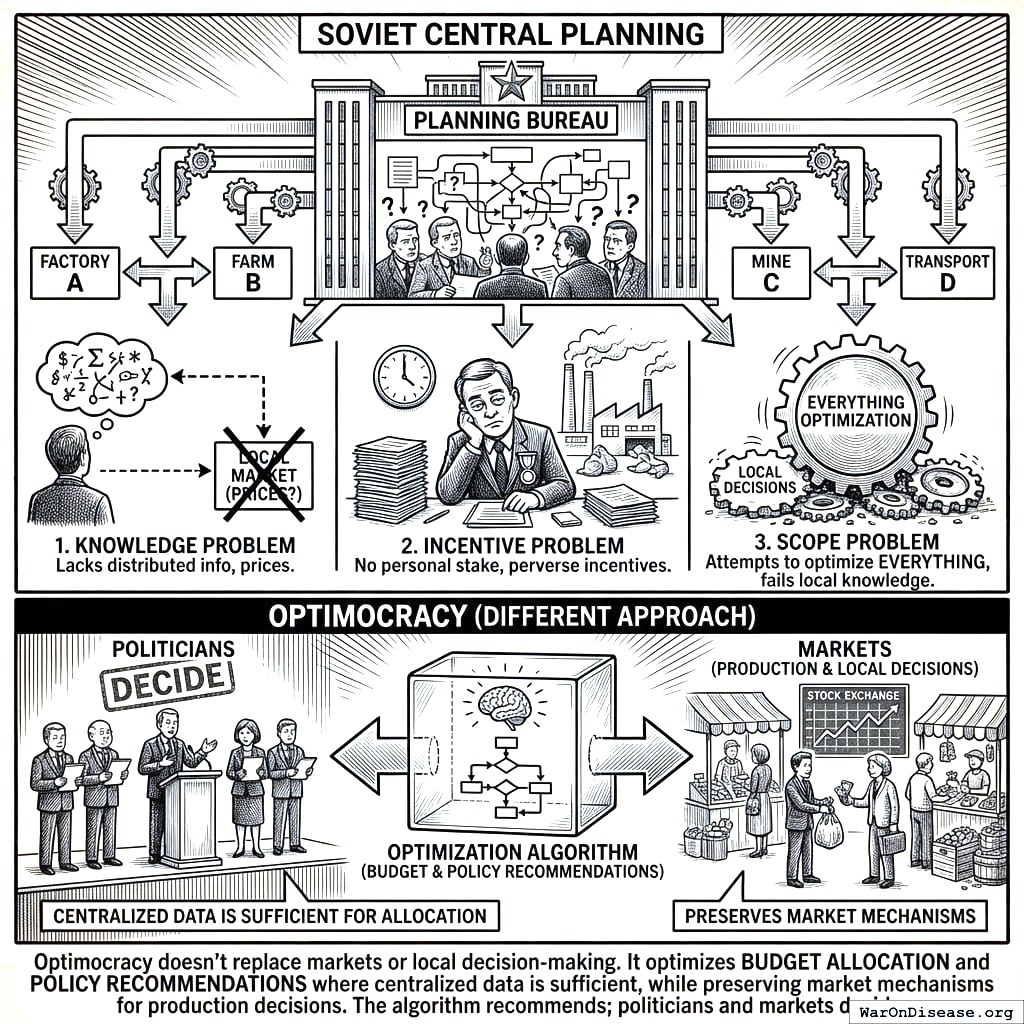
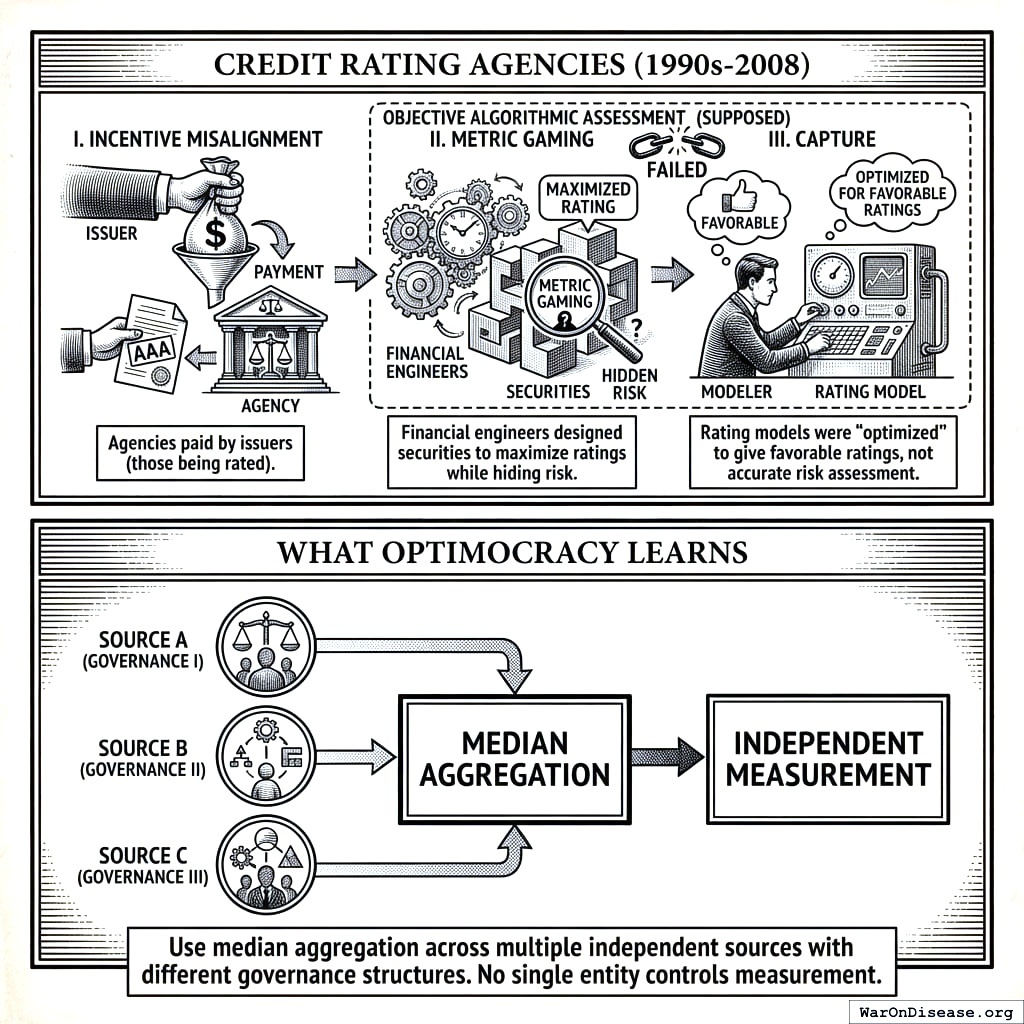
Theoretical Foundations
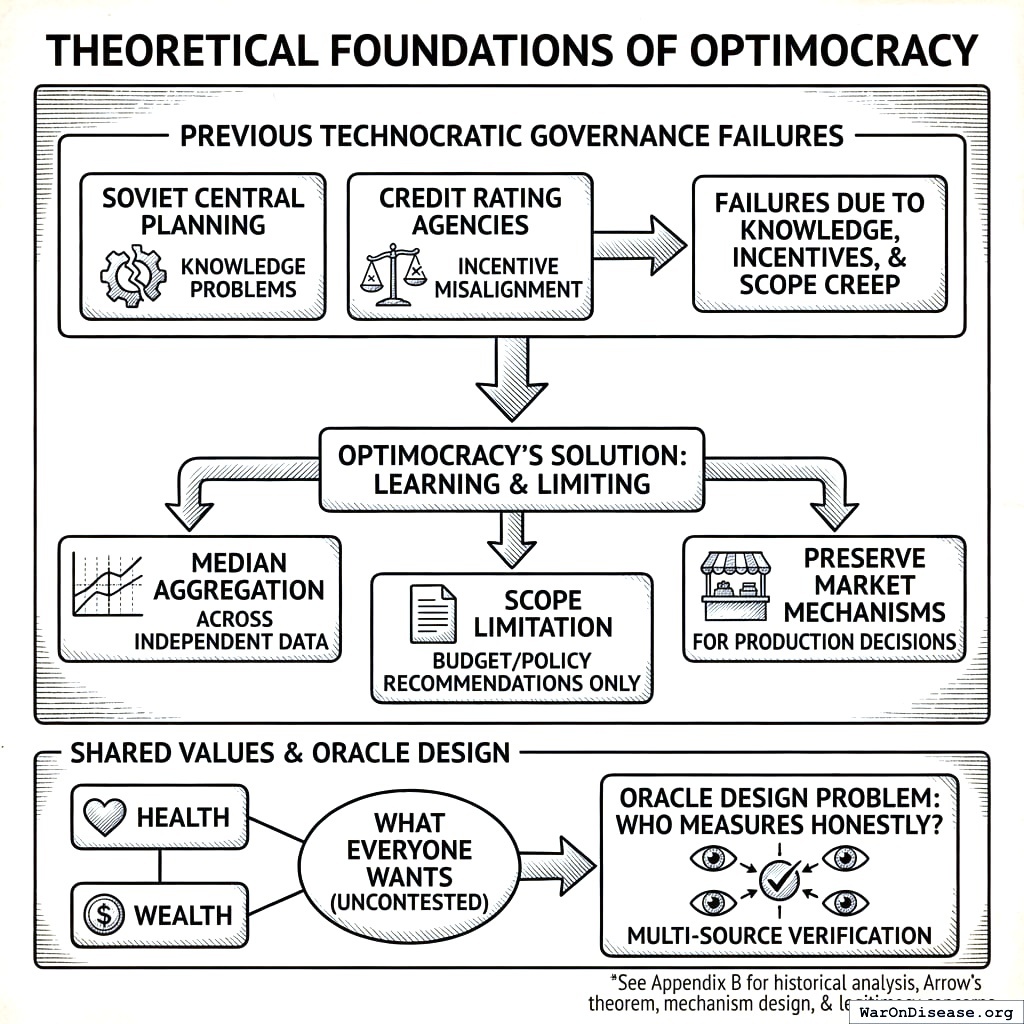
Previous attempts at technocratic governance (Soviet central planning, credit rating agencies) failed due to knowledge problems, incentive misalignment, and scope creep. Optimocracy learns from these failures by using median aggregation across independent data sources, limiting scope to budget/policy recommendations (not comprehensive planning), and preserving market mechanisms for production decisions. For detailed historical analysis and engagement with Arrow’s impossibility theorem, mechanism design theory, and democratic legitimacy concerns, see Appendix B.
Critically, Optimocracy also avoids the Soviet knowledge problem because it does not plan from first principles. It learns from decentralized experiments that already happened. Thousands of jurisdictions have already tried different policies; Optimocracy uses causal inference to identify which choices led to better outcomes. This is empirical pattern recognition across natural experiments, not central planning.
Health and wealth aren’t contested values requiring democratic selection. They’re what everyone already wants. The hard problem isn’t “what should we optimize?” but “who measures it honestly?” That’s an oracle design problem, addressed through multi-source verification.
Precedents That Work
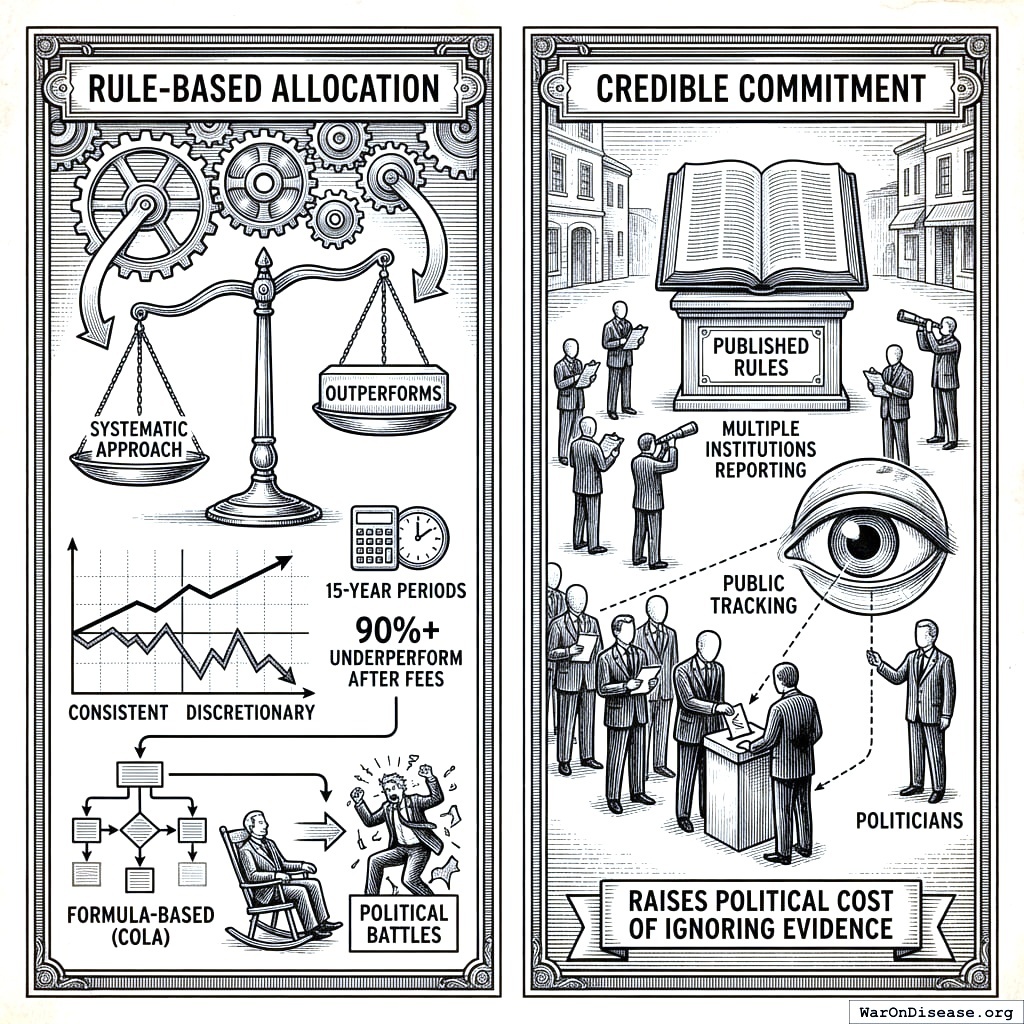
Rule-based allocation: Systematic approaches consistently outperform discretionary judgment across domains. Over 15-year periods, 90%+ of active fund managers underperform benchmark indices after fees143. Formula-based programs like Social Security COLA remove annual political battles over adjustments.
Credible commitment: Published rules make deviation visible. Multiple institutions report outcomes. Politicians vote freely, but alignment with recommendations is tracked publicly. This raises the political cost of ignoring evidence.
Mechanism Design
Architecture Overview
Optimocracy is purely advisory. It operates through three functions:
┌─────────────────────────────────────────────────────────┐
│                    RECOMMEND                             │
│  - Algorithm calculates optimal policies/budgets        │
│  - Optimizes for Health & Wealth (universal values)     │
│  - Publishes recommendations for every major vote       │
└─────────────────────────────────────────────────────────┘
                          │
                          ▼
┌─────────────────────────────────────────────────────────┐
│                      TRACK                               │
│  - Politicians vote however they want                   │
│  - System records alignment with recommendations        │
│  - Voting records are public                            │
└─────────────────────────────────────────────────────────┘
                          │
                          ▼
┌─────────────────────────────────────────────────────────┐
│                      REWARD                              │
│  - IABs provide campaign support & career opportunities │
│  - 80% aligned = 2x the support of 40% aligned          │
│  - Metric trends validate the system, attract funding   │
└─────────────────────────────────────────────────────────┘
What about edge cases, catastrophic risks, novel situations? Politicians handle them. That’s their job. The algorithm recommends; politicians decide. If a recommendation seems dangerous or wrong, they ignore it and face public accountability for that choice. The system tracks and rewards, nothing more.
The Verification Layer
Verification systems translate real-world outcomes into data that allocation algorithms can act upon. The critical design challenge is verification capture: if a single entity controls the data feed, they effectively control the allocation.
Concrete example (measuring median income growth):
| Census Bureau |
American Community Survey |
+2.1% |
| Federal Reserve |
Survey of Consumer Finances |
+2.3% |
| Bureau of Labor Statistics |
Current Population Survey |
+1.9% |
| University of Michigan |
Panel Study of Income Dynamics |
+2.2% |
| Tax Foundation |
IRS data analysis |
+2.0% |
Aggregation: Take the median of all five sources → +2.1%
If one source reported +5.0% (an outlier), it would be excluded by the median. The system doesn’t require trust in any single institution, only that a majority aren’t colluding. Since these institutions have different governance structures, funding sources, and methodologies, coordinated manipulation is difficult.
The correlated data problem and its solution:
An important limitation: the five sources above all ultimately rely on the same underlying data (Census surveys, tax records, employer reports). Their errors are correlated, meaning “five independent sources” may be an illusion. If the underlying methodology is captured, all five report the same biased figure.
This is a real concern. The solution is genuinely independent data collection via decentralized citizen surveys.
Decentralized Survey Architecture:
| Identity verification |
National digital ID, bank KYC, or similar |
Prevents fake-identity attacks (one person = one response) |
| Data collection |
Standard web/mobile interface |
No technical expertise required |
| Storage |
Secure database with audit logs |
Can’t be retroactively altered without detection |
| Aggregation |
Open-source algorithm |
Transparent, anyone can verify |
| Privacy |
Anonymization after identity verification |
Responses can’t be linked to individuals |
Why individual gaming is irrelevant:
With millions of survey responses, one person lying has approximately zero impact on the aggregate. Survey responses are aggregated statistically, so there is no strategic incentive to misreport.
The Execution Layer
Given the objective function and data feeds, the execution layer performs constrained optimization:
\[
\max_{\mathbf{x}} M(\mathbf{x}) \quad \text{subject to} \quad \sum_i x_i = B, \quad x_i \geq 0
\]
Where \(M(\cdot)\) is the chosen metric, \(\mathbf{x}\) is the allocation vector, and \(B\) is the total budget.
The primary analytical engine uses causal inference on cross-jurisdictional time-series data: synthetic control methods, difference-in-differences, and regression discontinuity designs applied to decades of policy variation across thousands of jurisdictions. This is the core of Optimocracy: not theoretical modeling, but empirical identification of which real-world policy choices actually predicted better outcomes.
Supplementary methods include:
- Randomized controlled trials: Allocate experimental budgets to estimate causal effects of novel interventions with no historical variation to learn from
- Prediction markets: Aggregate distributed information about allocation effectiveness for forward-looking decisions
- Machine learning: Identify complex nonlinear patterns in the cross-jurisdictional dataset that traditional econometric methods may miss
The execution system publishes recommendations and tracks politician alignment for IAB rewards. Outcome measurement validates the system over time.
For a concrete worked example of how the optimization algorithm calculates allocations, see Appendix A: Technical Specification Sketch.
Welfare Metrics
Default Implementation: Two-Metric Welfare Function
For practical implementation, the Optimocracy framework provides a simplified two-metric system that captures core welfare dimensions without requiring complex conversion factors or contested weighting decisions:
Metric 1: Real After-Tax Median Income Growth
- Definition: Year-over-year percentage change in inflation-adjusted, post-tax median household income
- Units: Percentage points per year (pp/year)
- Sources: Census Bureau, BLS, national statistical offices
- Why median: Captures typical citizen welfare without billionaire skew
- Why after-tax: Reflects actual purchasing power after government transfers
- Why growth rate: Enables cross-jurisdiction comparison regardless of baseline
Metric 2: Median Healthy Life Years
- Definition: Expected years of life in good health at the population median
- Units: Years
- Sources: WHO Global Health Observatory, national health surveys (BRFSS in US)
- Relationship to QALYs: Healthy life years ≈ life expectancy × average health utility
The Welfare Function
\[
W_j = \alpha \cdot \text{IncomeGrowth}_j + (1-\alpha) \cdot \text{HealthyYears}_j
\]
Default weighting: \(\alpha = 0.5\) (equal weight to economic and health welfare). Alternative weightings can be selected through democratic process.
Why These Two Metrics Work
Most policy effects eventually show up in one or both:
| Employment |
More jobs → higher wages → higher median income |
| Tax policy |
Directly changes after-tax income |
| Transfer programs |
Social Security, EITC → directly change after-tax income |
| Cost of living |
Inflation adjustment captures housing, food, healthcare costs |
| Market power |
Monopoly pricing → lower real income |
| Education quality |
Better skills → better wages → higher income |
| Crime/instability |
Lower productivity → lower wages |
| Trade policy |
Consumer prices, job markets → flow through income |
If GDP rises but median after-tax income doesn’t, the policy correctly registers as low-welfare. Gaming this metric is hard because it requires actually improving typical household purchasing power.
| Healthcare access |
More treatment → longer healthier life |
| Environmental regulation |
Less pollution → fewer respiratory/cancer deaths |
| Occupational safety |
Fewer workplace injuries/deaths |
| Mental health policy |
Suicide prevention, addiction treatment → life years |
| Public safety |
Lower homicide/accident rates → life years |
| Lifestyle policy |
Tobacco/alcohol taxes → behavioral health |
| Elder care |
Quality of late-life health |
| Food safety |
Fewer foodborne illness deaths |
Using median (not mean) avoids distortion from extremes like infant mortality or billionaire longevity clinics. It captures what a typical person can expect.
Why Two Metrics Beat Long Indicator Lists
Why not track 50 outcomes instead of 2? Three reasons:
Gaming multiplies: Each additional target creates a new way to cheat. Two broad, hard-to-fake outcomes are easier to audit than 50 narrow ones.
Errors compound: Composite indices (like HDI’s 11 indicators) aggregate noise. Disagreements over weights become proxy wars for policy preferences.
Veto points accumulate: With 50 metrics, every policy “harms” something. Analysis paralysis replaces action.
Markets figured this out: firms optimize profit, not 200 sub-metrics. Profit combines customer satisfaction, efficiency, and innovation into one number. These two welfare metrics do the same for policy.
What This Covers
Most policies affect one or both metrics:
- Economic policies (taxes, regulations, trade) primarily affect income growth
- Health policies (healthcare access, public health, safety) primarily affect healthy life years
- Many policies (education, infrastructure) affect both
What about edge cases? Politicians handle them. Optimocracy is purely advisory. If a recommendation seems to violate rights, increase catastrophic risk, or harm minorities, politicians ignore it. That’s their job. The algorithm recommends what maximizes health and wealth; politicians decide whether to follow.
This two-metric system is used by both the Optimal Policy Generator for policy recommendations and the Optimal Budget Generator for spending targets, ensuring consistency across the Optimocracy framework.
Advantages Over Political Governance
Capture Resistance
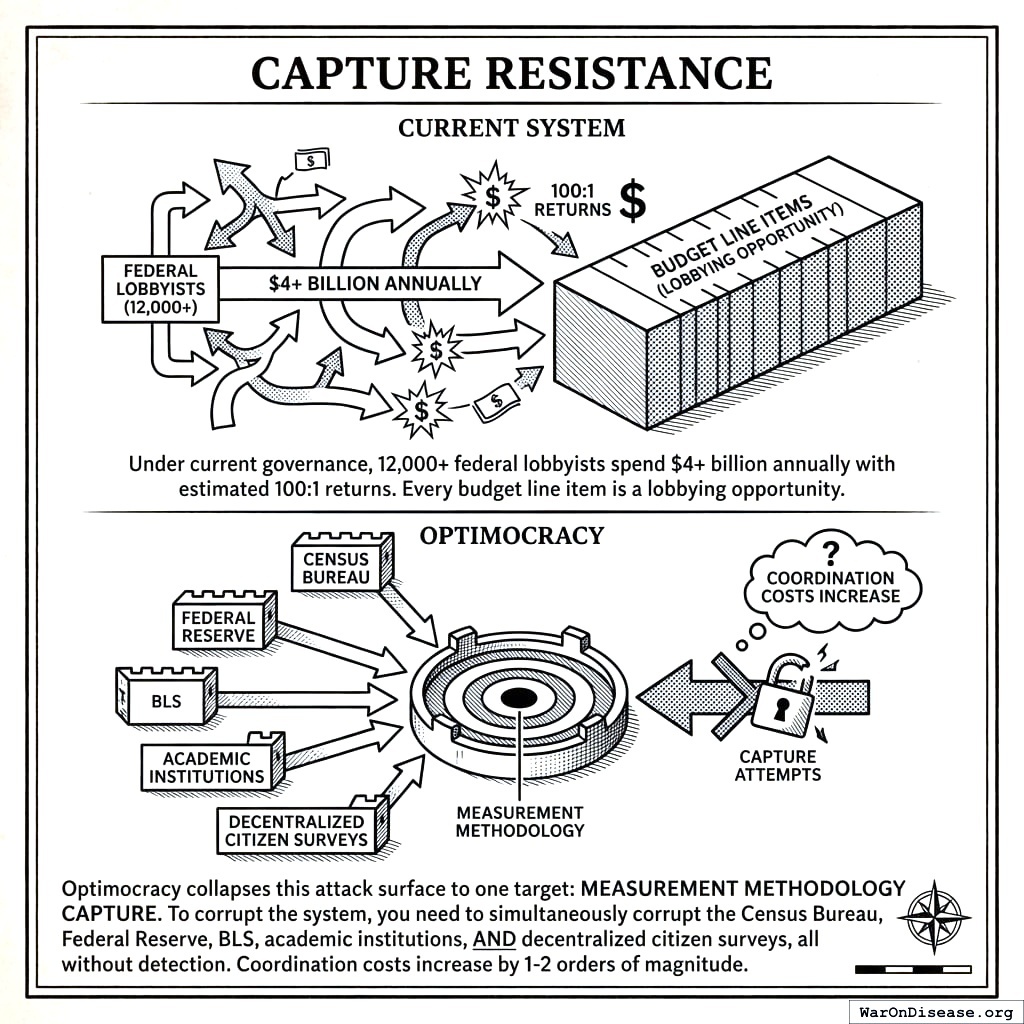
Under current governance, 12,000+ federal lobbyists spend $4+ billion annually with estimated 100:1 returns144. Every budget line item is a lobbying opportunity.
Optimocracy collapses this attack surface to one target: measurement methodology capture. To corrupt the system, you need to simultaneously corrupt the Census Bureau, Federal Reserve, BLS, academic institutions, AND decentralized citizen surveys, all without detection. Coordination costs increase by 1-2 orders of magnitude.
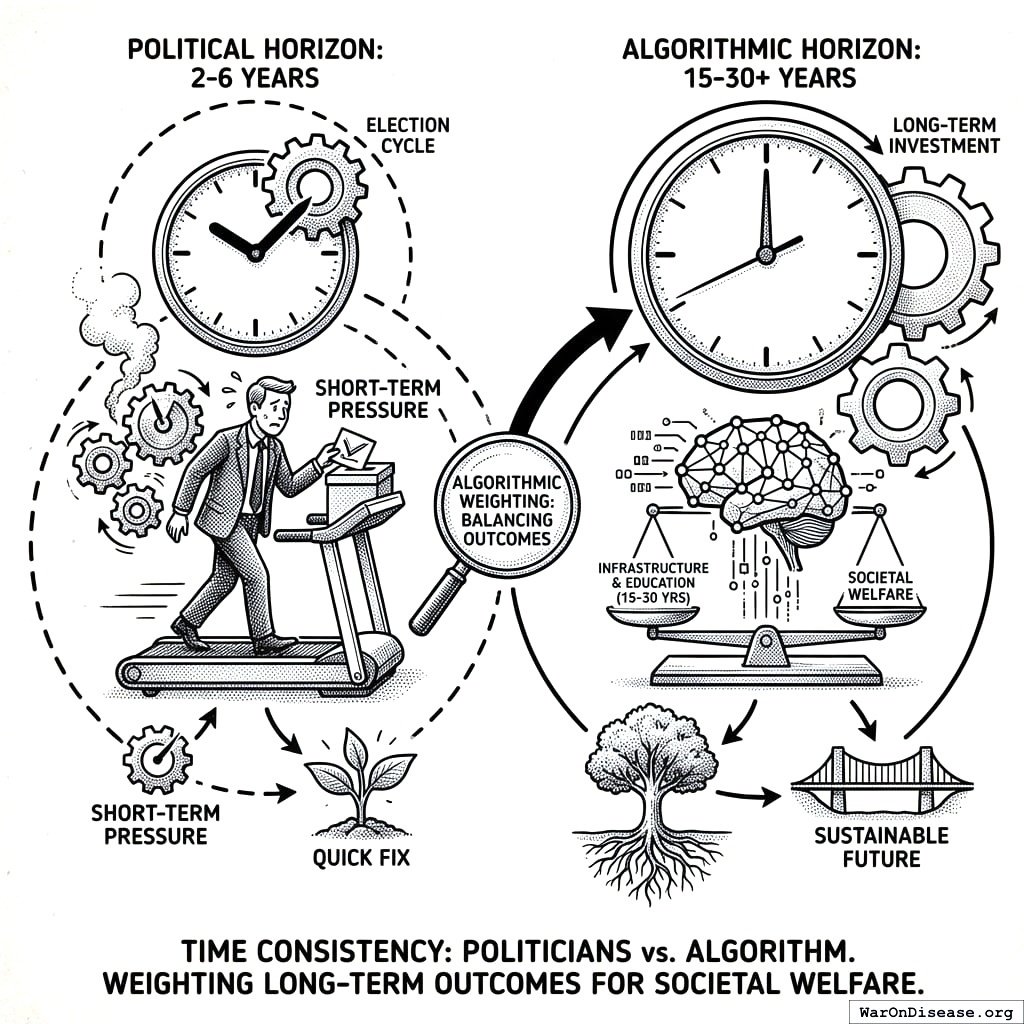
Time Consistency
Politicians face 2-6 year horizons; welfare-improving investments often take 15-30 years to pay off. The algorithm weights long-term outcomes appropriately because it doesn’t face reelection.
Transparency
| Objective |
Unstated |
Explicit, published |
| Decision process |
Closed-door negotiations |
Open-source algorithm |
| Deviation detection |
Requires investigative journalism |
Automatic, publicly verifiable |
Any citizen can verify alignment. Politicians who ignore recommendations must do so on the record.
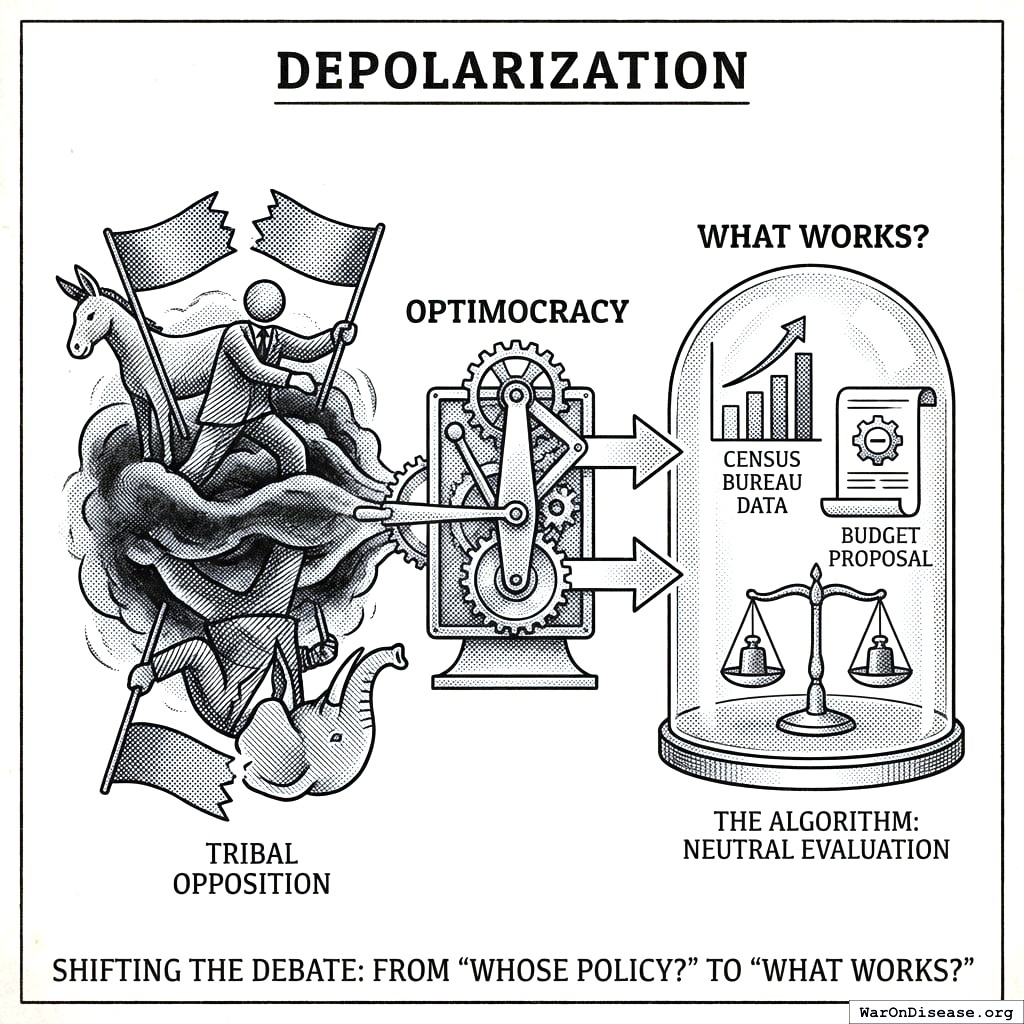
Depolarization
Current politics rewards tribal opposition. Optimocracy shifts the debate from “whose policy?” to “what works?” The algorithm doesn’t know which party proposed the budget. You can’t spin the Census Bureau as a Democratic or Republican institution. The number either went up or it didn’t.
Challenges and Failure Modes
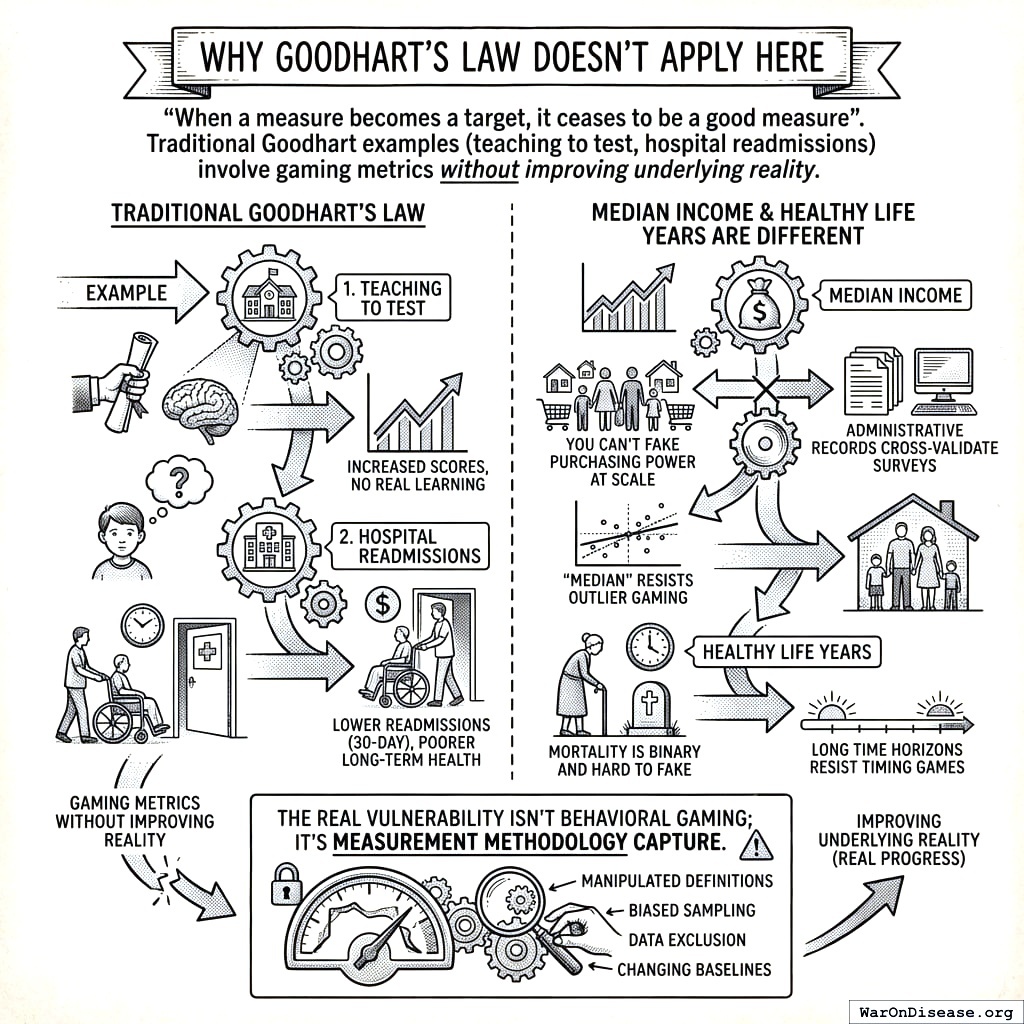
Why Goodhart’s Law Doesn’t Apply Here
“When a measure becomes a target, it ceases to be a good measure”145. Traditional Goodhart examples (teaching to test, hospital readmissions) involve gaming metrics without improving underlying reality.
Median income and healthy life years are different: You can’t fake purchasing power at scale; administrative records cross-validate surveys. Mortality is binary and hard to fake. “Median” resists outlier gaming. Long time horizons resist timing games.
The real vulnerability isn’t behavioral gaming; it’s measurement methodology capture.
Oracle Capture (The Real Challenge)
If adversaries control the data feed, they control the allocation. This is the main attack surface.
Attack vectors: Direct manipulation, methodology capture (“redefine median household”), sample selection, timing manipulation, institutional collusion.
Government statistics are not neutral: Unemployment definitions (U3 vs U6) differ by 50%+. CPI methodology has changed 20+ times since 1978. With trillions at stake, the incentive to influence measurement is enormous.
Defense-in-depth:
| Multiple independent sources (5+) |
Capturing five agencies with different governance is much harder than one |
| Decentralized citizen surveys |
Ground truth that exposes manipulation in official statistics |
| International benchmarking |
Makes domestic manipulation visible via OECD/UN comparison |
| Academic replication |
Adversarial verification with reputation incentives |
The honest assessment: Oracle capture is not a solvable technical problem. The question is whether oracle capture is less damaging than current allocation capture. The answer may be yes: oracle capture affects measurement, while allocation capture affects outcomes directly. The wrapper architecture converts oracle capture from catastrophic failure to degraded performance, as politicians can ignore manipulated data.
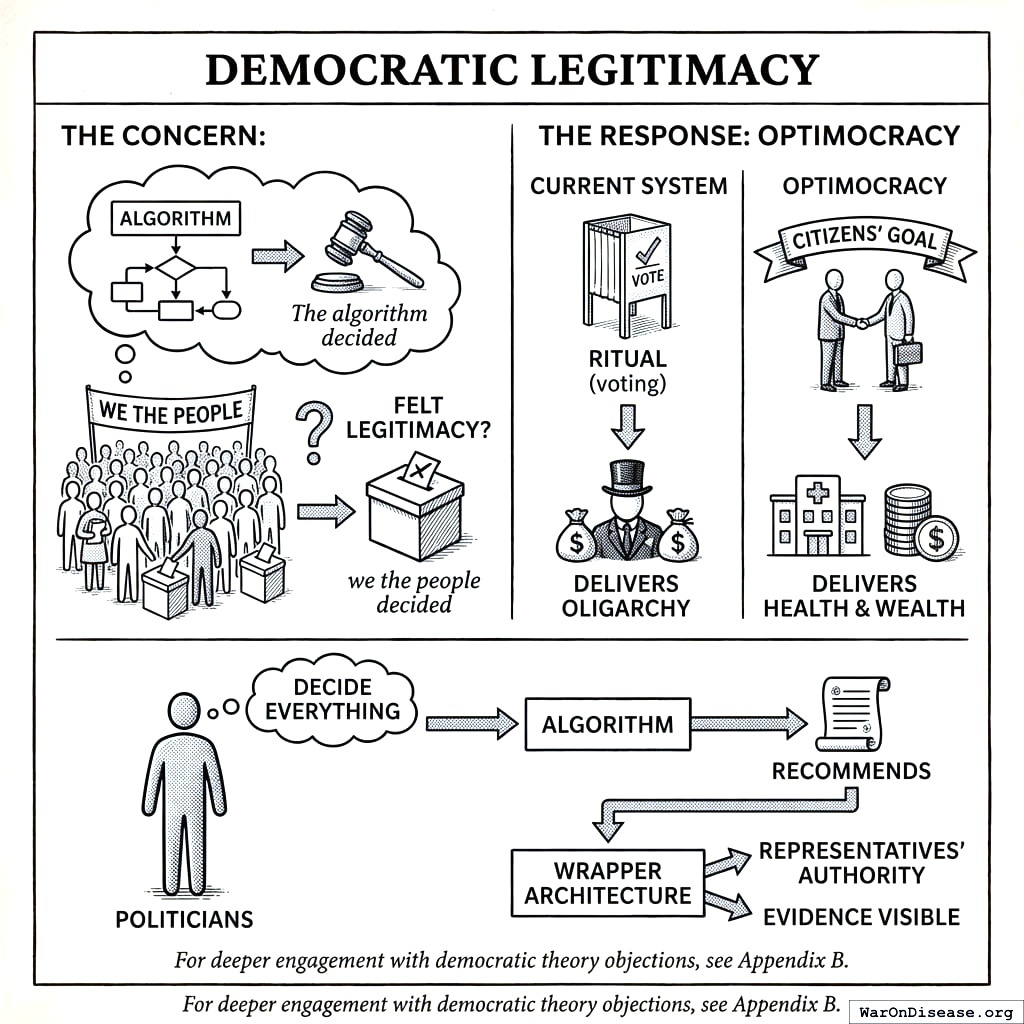
Democratic Legitimacy
The concern: “The algorithm decided” lacks the felt legitimacy of “we the people decided.”
The response: Optimocracy is more democratic, not less. The current system offers ritual (voting) but delivers oligarchy (133). Optimocracy delivers what citizens actually voted for: health and wealth.
Politicians still decide everything. The algorithm only recommends. Citizens choose the goal; we already delegate implementation to the Fed and FDA. The wrapper architecture preserves representatives’ authority completely while making their alignment with evidence visible.
For deeper engagement with democratic theory objections, see Appendix B.
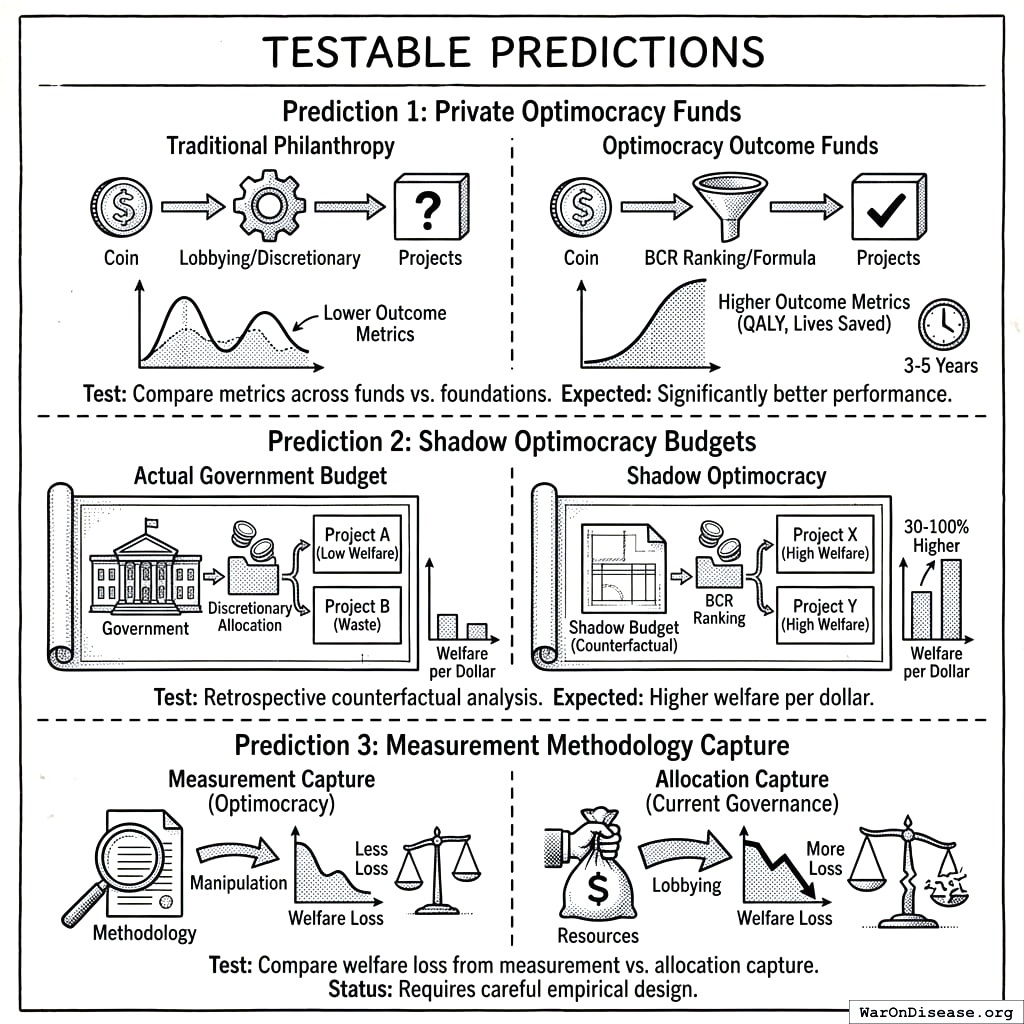
Testable Predictions
A publishable theory must generate falsifiable predictions. This section presents predictions that would confirm or refute the Optimocracy thesis. (Note: Existing evidence already supports the general case for algorithmic over discretionary allocation; formula programs like Social Security show lower lobbying intensity than discretionary programs144. The predictions below are specific to Optimocracy.)
Prediction 1: Private Optimocracy funds will outperform traditional philanthropic allocation on chosen metrics.
- Test: Compare QALY/\(, lives saved/\), or similar metrics across Optimocracy outcome funds vs. traditional foundations
- Expected finding: Optimocracy allocation achieves significantly better metric performance (commensurate with eliminating the Crony Tax)
- Timeline: Testable within 3-5 years of deployment
Prediction 2: Shadow Optimocracy budgets will outperform actual government budgets in retrospective analysis.
- Test: Construct counterfactual “what if government allocated according to BCR rankings” and compare projected outcomes
- Expected finding: Shadow budget shows 30-100% higher welfare per dollar
- Timeline: Testable immediately with existing data
Prediction 3: Measurement methodology capture under Optimocracy will be less welfare-reducing than allocation capture under current governance.
- Test: Compare welfare loss from documented measurement manipulation vs. documented lobbying/capture
- Expected finding: Measurement capture is harder and less damaging than allocation capture
- Status: Requires careful empirical design
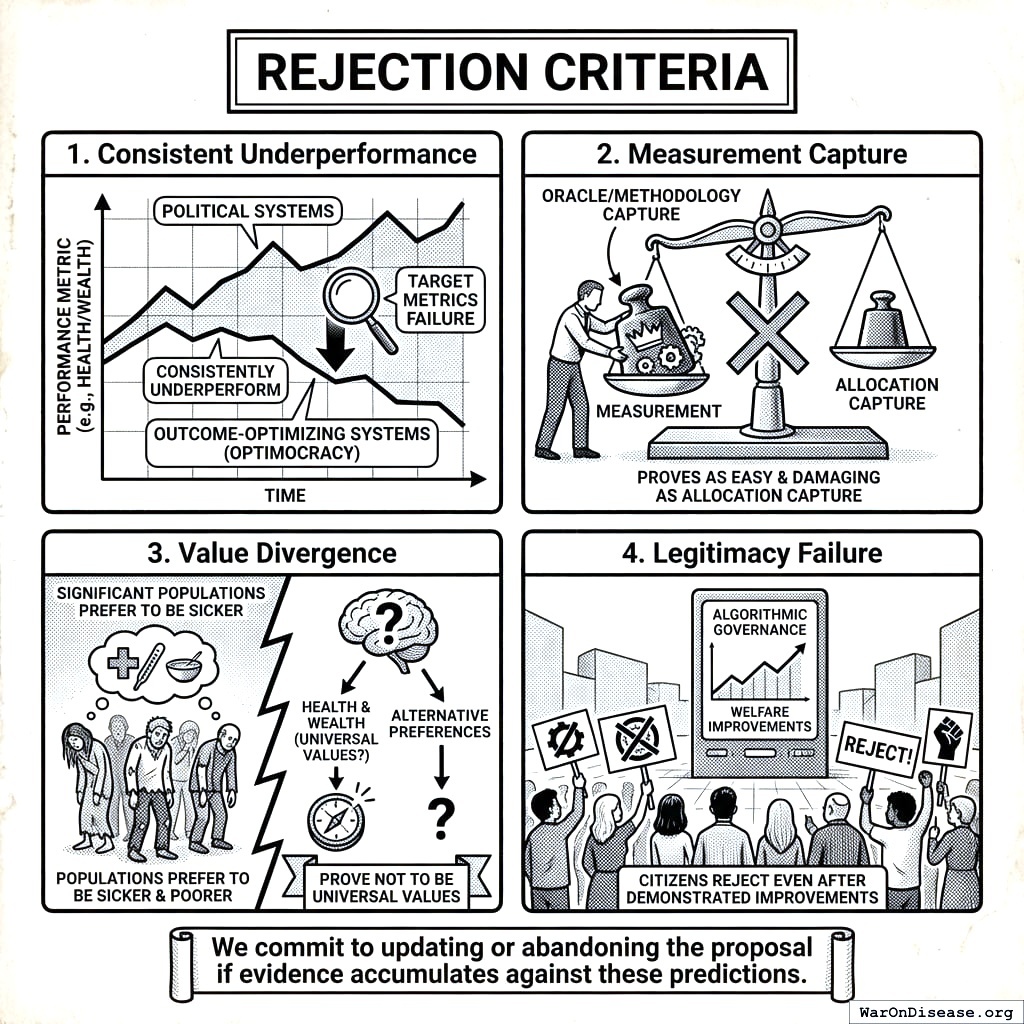
Rejection Criteria
The Optimocracy thesis would be falsified by:
- Consistent underperformance: If outcome-optimizing systems consistently underperform political systems on their target metrics
- Measurement capture: If oracle/methodology capture proves as easy and damaging as current allocation capture
- Value divergence: If health and wealth prove NOT to be universal values (if significant populations genuinely prefer to be sicker and poorer)
- Legitimacy failure: If citizens reject algorithmic governance even after demonstrated welfare improvements
We commit to updating or abandoning the proposal if evidence accumulates against these predictions.
The Wrapper Architecture: How Funding Works
Optimocracy provides the what (evidence-based recommendations); the SuperPAC provides the how (making alignment profitable). The integration works as follows:
| Optimocracy publishes recommendations |
“Support HR-1234 (early childhood funding increase).” “Oppose HR-5678 (regulatory capture provision).” |
| Votes recorded |
Senator Smith votes aligned on both (2/2 = 100%). Senator Jones votes misaligned on both (0/2 = 0%). |
| Alignment scores calculated |
End-of-quarter totals: Smith 78% aligned with recommendations. Jones 34% aligned. |
| SuperPAC allocates support |
Algorithm weighs: alignment difference between candidates, position power, race competitiveness, marginal funding impact. Smith’s competitive race with high alignment gets priority. |
| Public transparency |
Citizens see: “Smith followed evidence-based recommendations 78% of the time.” |
| System validation (ongoing) |
Over years, metrics trend upward. This validates the recommendations, attracting more donations. |
Funding sources:
Donations (primary): Donations are high-leverage. Historical lobbying ROI suggests $1 of campaign spending can shift $100+ in policy outcomes. This makes funding Optimocracy more effective than traditional charity.
Incentive Alignment Bonds (for specific reallocations): When Optimocracy recommends a specific funding reallocation (like the 1% Treaty), IABs can provide investor returns tied to policy success. Investors get a percentage of redirected funds, scaling funding beyond donations.
Campaign Funding Allocation Algorithm
The SuperPAC maximizes expected governance improvement per dollar. For each race, calculate:
\[
E[\Delta G] = \text{alignment\_gap} \times \text{position\_power} \times \text{win\_probability\_shift} \times P(\text{marginal\_dollar\_matters})
\]
Factors:
| Alignment gap |
|candidate_A_score - candidate_B_score| |
78% vs 34% = 44-point gap |
| Position power |
Committee chairs, leadership, swing votes |
Health Committee chair = 3× multiplier |
| Race competitiveness |
How much can funding shift the outcome? |
48-52 polling = high; 30-70 = zero |
| Marginal funding effectiveness |
Diminishing returns as spending increases |
First $1M matters more than 10th $1M |
Allocation priority examples:
| Senate (Health Cmte chair) |
40 pts |
Close (48-52) |
High |
Top |
| Senate (backbencher) |
40 pts |
Close (48-52) |
Medium |
High |
| House (swing district) |
30 pts |
Close (49-51) |
Low |
Medium |
| Senate (safe seat) |
50 pts |
Landslide (70-30) |
High |
Low (can’t shift outcome) |
| House (safe seat) |
10 pts |
Safe (60-40) |
Low |
Skip |
A close race with a large alignment gap gets priority over a safe seat, even if the safe-seat candidate has higher absolute alignment. Funding flows where it can actually change outcomes.
Dynamic reallocation: As polling shifts during election season, the algorithm reallocates. A race that becomes uncompetitive frees funds for newly competitive races.
Implementation Pathway
Why Government Adoption Isn’t Required
Optimocracy operates as a permanent advisory layer. Politicians don’t surrender power; they just face new incentives. The question changes from “Will politicians give up power?” (hard) to “Can we fund the SuperPAC enough to make ignoring recommendations unprofitable?” (tractable). This reframing converts the implementation problem from a political revolution to a fundraising challenge.
Implementation Strategy
Optimocracy does not require government permission for private fund allocation. The technology exists today. The strategy: start private → demonstrate → scale.
- Private Outcome Fund: Deploy $10M+ for philanthropic capital, prove mechanism works
- Shadow Tracking: Generate counterfactual “what would Optimocracy allocate?” to demonstrate outperformance
- Government Pilots: Partner with reform-minded jurisdictions for limited-scope pilots
- Broader Adoption: Scale through demonstrated success and competitive pressure
The bottleneck is not technology. The bottleneck is coordination: assembling capital, coalition members, and governance structures. Starting small is a feature: a $10M outcome fund with 50 committed participants can experiment, fail fast, and improve before scaling.
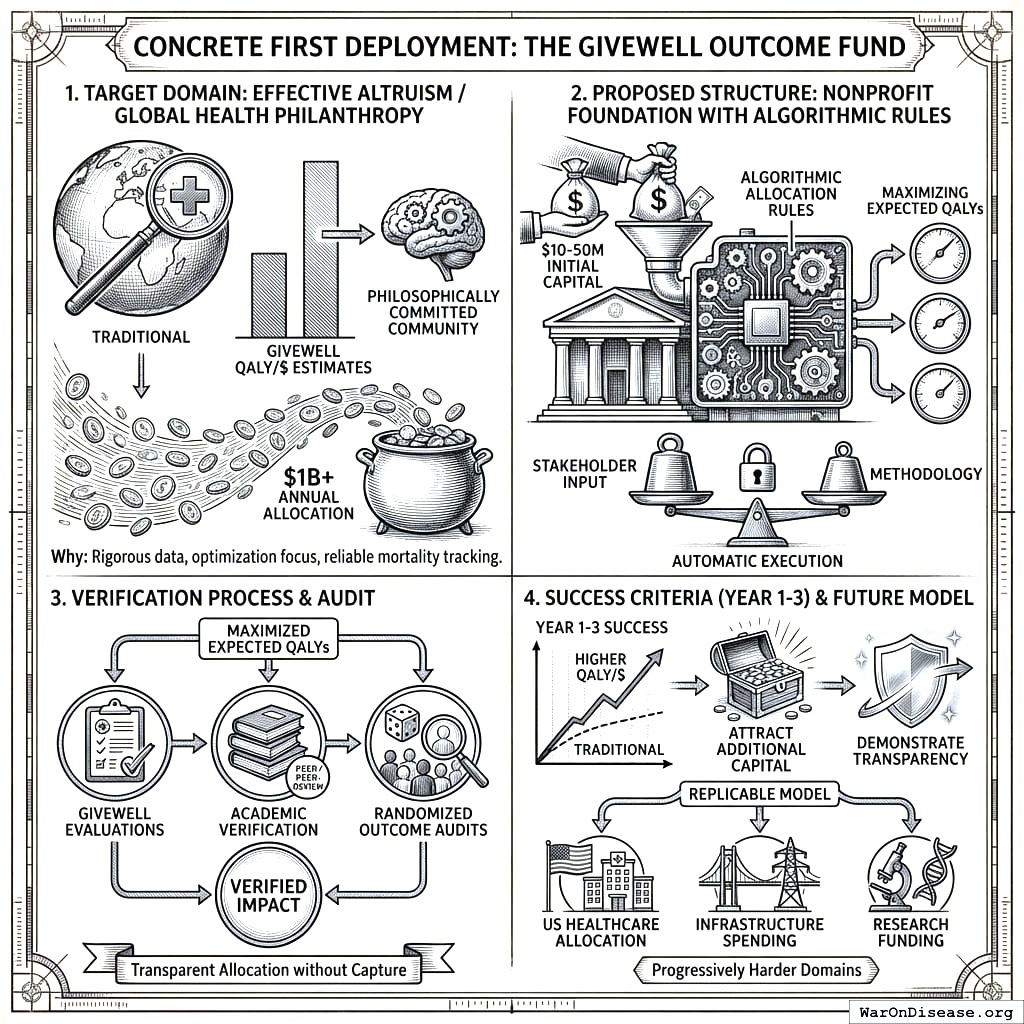
Concrete First Deployment: The GiveWell Outcome Fund
We propose a specific first deployment to make Optimocracy actionable rather than theoretical.
Target domain: Effective altruism / global health philanthropy. Why: GiveWell already produces rigorous QALY/$ estimates, the EA community is philosophically committed to outcome optimization, mortality data is increasingly reliable, and the community allocates $1B+ annually.
Proposed structure: Nonprofit foundation with algorithmic allocation rules, $10-50M initial capital from aligned foundations, maximizing expected QALYs verified by GiveWell evaluations + academic verification + randomized outcome audits. Stakeholder input on methodology; algorithm execution is automatic.
Success criteria (Year 1-3): Achieve measurably higher QALY/$ than comparable traditional foundations, demonstrate transparent allocation without capture, attract additional capital, and generate replicable model for progressively harder domains (US healthcare allocation, infrastructure spending, research funding).
Conclusion
Political governance is not failing because politicians are evil or voters are ignorant. It is failing because the incentive structure makes capture inevitable. No amount of transparency, campaign finance reform, or civic education can eliminate the fundamental misalignment between political incentives and citizen welfare.
Optimocracy offers a different approach: rather than relying on systems that don’t optimize for outcomes, introduce outcome-optimizing allocation for decisions where optimization is feasible. Define the objective democratically, measure outcomes rigorously, allocate algorithmically, and enforce via transparent rules.
The precedents are encouraging. Formula-based programs like Social Security COLA remove annual political battles. Published, transparent allocation rules enable credible commitment by making deviation visible.
Optimocracy is not utopian. It faces real challenges: measurement methodology capture, edge cases, and democratic legitimacy. But these challenges are addressable through institutional diversity, the wrapper architecture, and iterative implementation.
The question is not whether Optimocracy is perfect; no governance system is. The question is whether outcome-optimizing algorithmic allocation produces better outcomes than captured allocation. The evidence suggests it does.
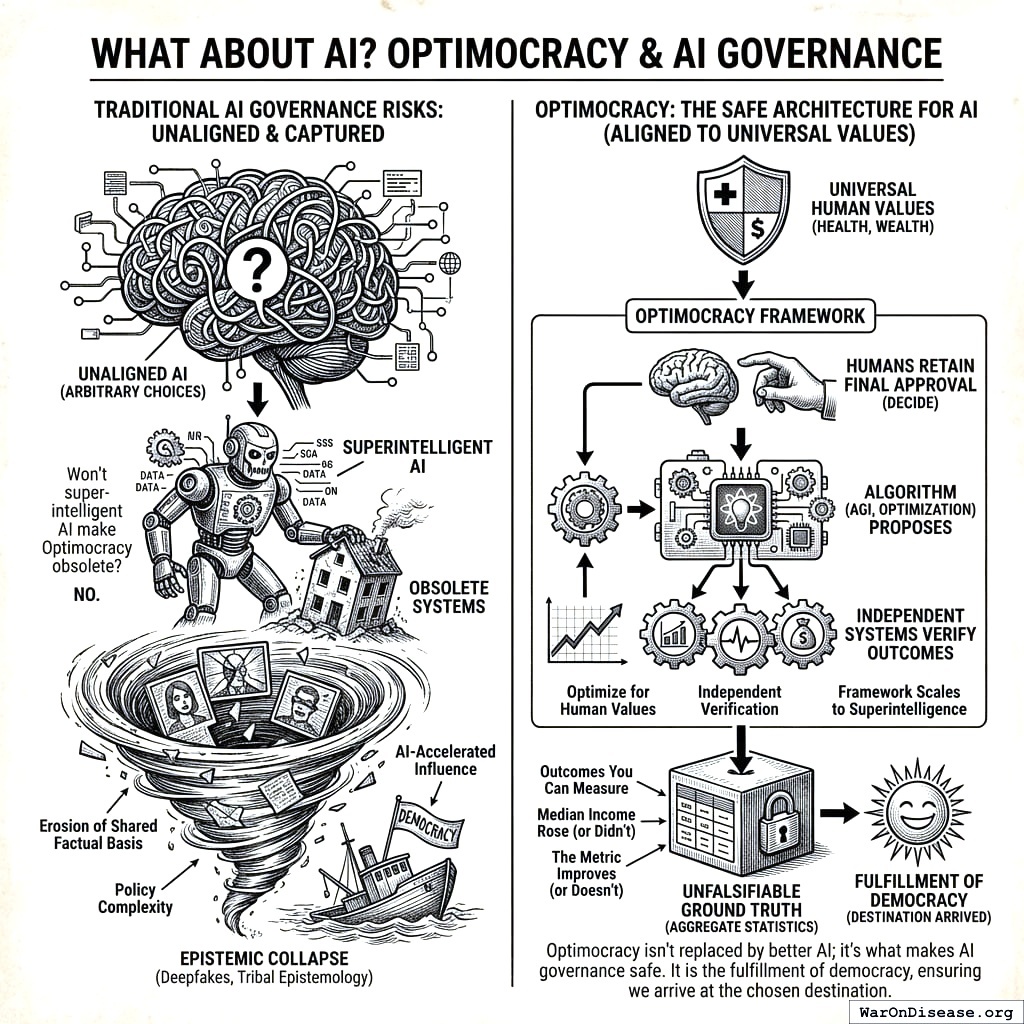
What About AI?
Some may ask: won’t superintelligent AI make Optimocracy obsolete? The answer is no. Optimocracy is the safe architecture for AI governance. “Aligned AI” requires specifying aligned to what. Health and wealth are the answer: universal human values, not arbitrary choices. Even a superintelligent AI should operate within an Optimocracy-like structure: optimize for what humans universally value, independent systems verify outcomes, and humans retain final approval authority. The algorithm (whether simple optimization or AGI) proposes; humans decide. Optimocracy isn’t replaced by better AI; it’s what makes AI governance safe. The framework scales from spreadsheet calculations to superintelligence while preserving human oversight.
We propose Optimocracy not as a replacement for democracy but as its fulfillment: a system where citizens genuinely choose outcomes, not just representatives who promise outcomes and deliver something else. Democracy selects the destination; Optimocracy ensures we actually arrive.
The urgency grows with each passing year. Deepfakes are eroding the shared factual basis democracy requires. Policy complexity increasingly exceeds human cognitive capacity. AI-accelerated influence operations will make capture orders of magnitude cheaper and more effective. The tribal epistemology that already interprets identical videos along partisan lines will have no ground truth whatsoever once synthetic media becomes indistinguishable from authentic footage. Optimocracy offers an exit from this epistemic collapse: outcomes you can measure, not narratives you must trust. Aggregate statistics from multiple independent sources provide unfalsifiable ground truth. Median income either rose or it didn’t. The metric either improves or it doesn’t. That fact provides a foundation for governance when all other foundations have eroded.
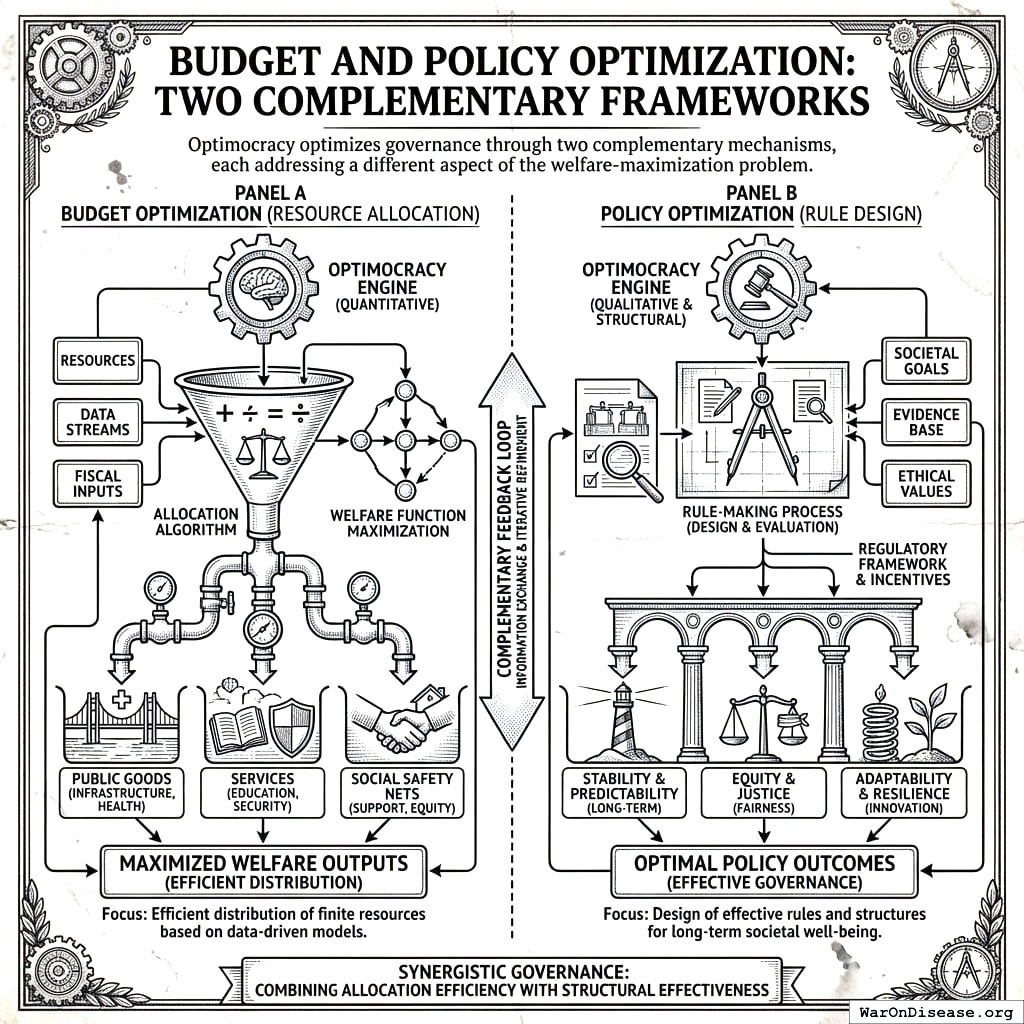
Appendix A: Technical Specification Sketch
Budget and Policy Optimization: Two Complementary Frameworks
Optimocracy optimizes governance through two complementary mechanisms, each addressing a different aspect of the welfare-maximization problem.
Budget Optimization: The Optimal Budget Generator (OBG) Framework
The Optimal Budget Generator (OBG) framework answers: “How should we allocate the budget to maximize welfare?”
Each spending category has an optimal level - not just a marginal return. Too little means underinvestment and foregone welfare gains; too much means diminishing returns. But unlike the Recommended Daily Allowance for nutrients (where you can meet all targets simultaneously), budget allocation is zero-sum: spending more on one category means less for others. OBG generates integrated recommendations that balance these tradeoffs.
| Below optimal |
Vitamin deficiency |
Foregone welfare gains |
| At optimal |
Recommended daily allowance |
Maximum return per dollar |
| Above optimal |
Diminishing returns / toxicity |
Waste, opportunity cost |
The OBG framework combines three evidence sources:
- Reference country benchmarking: What do high-performing peer countries spend?
- Diminishing returns modeling: Where is the “knee” of the spending-outcome curve?
- Cost-effectiveness threshold analysis: Which interventions pass standard health economics thresholds?
The Budget Impact Score (BIS) measures our confidence in each category’s target estimate based on the quality of causal evidence. Categories with strong RCT evidence have high BIS; categories with only cross-sectional correlations have low BIS.
Example output:
| Pragmatic clinical trials |
$0.5B |
$50B |
+$49.5B |
A (RCTs) |
| Vaccinations |
$8B |
$35B |
+$27B |
A (RCTs) |
| Basic research |
$45B |
$90B |
+$45B |
B (spillovers) |
| Military |
$850B |
$459B |
-$391B |
C (benchmarks) |
For the complete methodology including estimation procedures, validation framework, and worked examples, see Optimal Budget Generator Specification.
Policy Optimization: The Policy Impact Score (PIS) Framework
The Policy Impact Score (PIS) framework answers: “Which policy reforms would most improve welfare outcomes?”
This extends beyond budget allocation to evaluate all policies: laws, regulations, taxes, and administrative rules. Budget reallocation alone cannot fix structural inefficiencies:
| Program allocation |
Too little preventive care |
Yes (reallocate budget) |
| Administrative overhead |
~$1T/year US admin costs |
No (requires regulatory reform) |
| Drug pricing |
US pays 256% of OECD average148 |
No (requires policy change) |
PIS uses quasi-experimental methods (synthetic control, difference-in-differences, regression discontinuity) to estimate causal effects of policy changes across centuries of variation in hundreds of jurisdictions.
Example output:
| Tobacco tax (+$1/pack) |
-8.2 pp smoking rate |
A (synthetic control) |
| Seat belt laws (primary) |
-1.8 traffic deaths/100K |
A (DiD, 47 states) |
| Occupational licensing |
+2-3% consumer prices |
B (cross-state variation) |
For the complete methodology including database schema, Bradford Hill criteria mapping, and validation framework, see Optimal Policy Generator Specification.
How They Work Together
| OBG/BIS |
Spending category |
Integrated budget recommendations |
How much to spend? |
| PIS |
Policy/regulation |
Ranked reforms by impact |
Which policies to adopt? |
Both frameworks generate recommendations that politicians can follow or ignore:
+------------------------+    +------------------------+
|   Budget Optimization  |    |   Policy Optimization  |
|   (OBG/BIS Framework)  |    |   (PIS Framework)      |
|                        |    |                        |
|   Recommends:          |    |   Recommends:          |
|   - Optimal spending   |    |   - Which reforms      |
|     levels per category|    |     improve welfare    |
|   - Investment gaps    |    |   - Priority ranking   |
+------------------------+    +------------------------+
           |                              |
           +------------+  +--------------+
                        |  |
                        v  v
         +---------------------------+
         |   ORACLE VERIFICATION     |
         |   Independent measurement |
         |   of actual outcomes      |
         +---------------------------+
The Political Dysfunction Tax ($4.9T (95% CI: $3.62T-$6.5T) in US waste, $101T (95% CI: $83.3T-$191T) in global opportunity costs) arises from both misallocation (wrong spending levels) and bad policy (welfare-reducing regulations). Addressing both requires both frameworks working together.
Algorithmic Governance Threat Model
Any honest assessment of algorithmic governance must acknowledge potential failure modes and attack surfaces:
Known Failure Modes
| Verification manipulation |
Corrupting data feeds to trigger favorable allocations |
Multi-source aggregation, time-weighted averages, circuit breakers |
High: fundamental challenge |
| Parameter exploitation |
Gaming system rules through edge cases |
Formal verification, economic audits |
Medium: novel attacks possible |
| Administrative compromise |
Capturing upgrade or amendment authority |
Multi-party approval, time-locks, transparency requirements |
Medium: key management remains hard |
| Implementation errors |
Software bugs leading to unintended behavior |
Code audits, gradual deployment, bug bounties |
Medium: novel variants emerge |
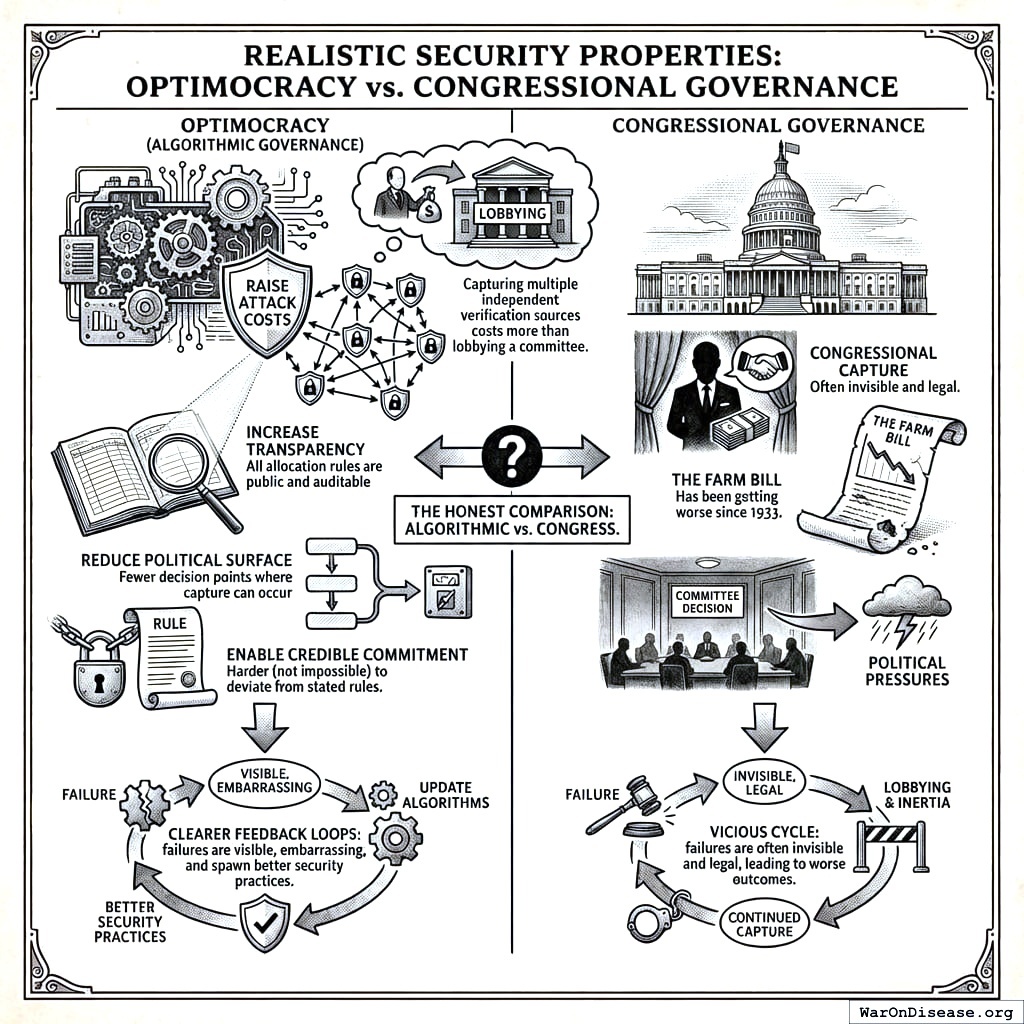
Realistic Security Properties
Optimocracy does not claim to eliminate all governance risk. It claims to:
- Raise attack costs: Capturing multiple independent verification sources costs more than lobbying a committee
- Increase transparency: All allocation rules are public and auditable
- Reduce political surface: Fewer decision points where capture can occur
- Enable credible commitment: Harder (not impossible) to deviate from stated rules
The honest comparison isn’t “algorithmic governance vs. perfect security.” It’s “algorithmic governance vs. Congress.” Algorithmic systems create clearer feedback loops between failure and correction: failures are visible, embarrassing, and spawn better security practices. Congressional capture is often invisible and legal. The Farm Bill has been getting worse since 1933. Neither system is perfect, and the process of updating algorithms in response to failures remains subject to political pressures, but algorithmic systems at least make failures visible.
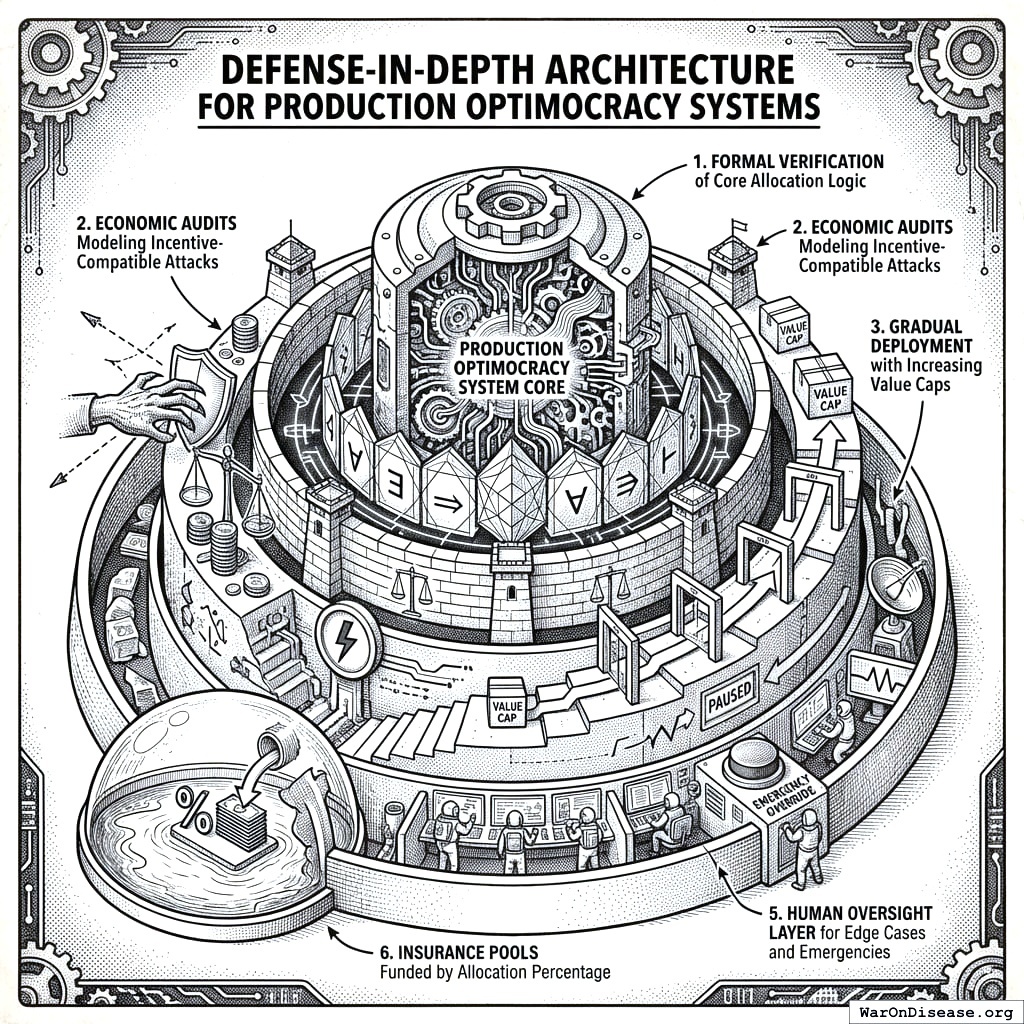
Defense-in-Depth Architecture
Production Optimocracy systems should implement:
- Formal verification of core allocation logic
- Economic audits modeling incentive-compatible attacks
- Gradual deployment with value caps that increase as the system proves reliable
- Circuit breakers that pause allocation if metrics move anomalously
- Human oversight layer for handling edge cases and emergencies
- Insurance pools funded by a percentage of allocations
Acknowledgments
Thanks to colleagues and reviewers who shared feedback on early drafts. Any remaining errors are mine.
References
1.
NIH Common Fund. NIH pragmatic trials: Minimal funding despite 30x cost advantage.
NIH Common Fund: HCS Research Collaboratory https://commonfund.nih.gov/hcscollaboratory (2025)
The NIH Pragmatic Trials Collaboratory funds trials at $500K for planning phase, $1M/year for implementation-a tiny fraction of NIH’s budget. The ADAPTABLE trial cost $14 million for 15,076 patients (= $929/patient) versus $420 million for a similar traditional RCT (30x cheaper), yet pragmatic trials remain severely underfunded. PCORnet infrastructure enables real-world trials embedded in healthcare systems, but receives minimal support compared to basic research funding. Additional sources: https://commonfund.nih.gov/hcscollaboratory | https://pcornet.org/wp-content/uploads/2025/08/ADAPTABLE_Lay_Summary_21JUL2025.pdf | https://www.ncbi.nlm.nih.gov/pmc/articles/PMC5604499/
.
2.
NIH. Antidepressant clinical trial exclusion rates.
Zimmerman et al. https://pubmed.ncbi.nlm.nih.gov/26276679/ (2015)
Mean exclusion rate: 86.1% across 158 antidepressant efficacy trials (range: 44.4% to 99.8%) More than 82% of real-world depression patients would be ineligible for antidepressant registration trials Exclusion rates increased over time: 91.4% (2010-2014) vs. 83.8% (1995-2009) Most common exclusions: comorbid psychiatric disorders, age restrictions, insufficient depression severity, medical conditions Emergency psychiatry patients: only 3.3% eligible (96.7% excluded) when applying 9 common exclusion criteria Only a minority of depressed patients seen in clinical practice are likely to be eligible for most AETs Note: Generalizability of antidepressant trials has decreased over time, with increasingly stringent exclusion criteria eliminating patients who would actually use the drugs in clinical practice Additional sources: https://pubmed.ncbi.nlm.nih.gov/26276679/ | https://pubmed.ncbi.nlm.nih.gov/26164052/ | https://www.wolterskluwer.com/en/news/antidepressant-trials-exclude-most-real-world-patients-with-depression
.
3.
CNBC. Warren buffett’s career average investment return.
CNBC https://www.cnbc.com/2025/05/05/warren-buffetts-return-tally-after-60-years-5502284percent.html (2025)
Berkshire’s compounded annual return from 1965 through 2024 was 19.9%, nearly double the 10.4% recorded by the S&P 500. Berkshire shares skyrocketed 5,502,284% compared to the S&P 500’s 39,054% rise during that period. Additional sources: https://www.cnbc.com/2025/05/05/warren-buffetts-return-tally-after-60-years-5502284percent.html | https://www.slickcharts.com/berkshire-hathaway/returns
.
4.
World Health Organization. WHO global health estimates 2024.
World Health Organization https://www.who.int/data/gho/data/themes/mortality-and-global-health-estimates (2024)
Comprehensive mortality and morbidity data by cause, age, sex, country, and year Global mortality: 55-60 million deaths annually Lives saved by modern medicine (vaccines, cardiovascular drugs, oncology): 12M annually (conservative aggregate) Leading causes of death: Cardiovascular disease (17.9M), Cancer (10.3M), Respiratory disease (4.0M) Note: Baseline data for regulatory mortality analysis. Conservative estimate of pharmaceutical impact based on WHO immunization data (4.5M/year from vaccines) + cardiovascular interventions (3.3M/year) + oncology (1.5M/year) + other therapies. Additional sources: https://www.who.int/data/gho/data/themes/mortality-and-global-health-estimates
.
5.
GiveWell. GiveWell cost per life saved for top charities (2024).
GiveWell: Top Charities https://www.givewell.org/charities/top-charities General range: $3,000-$5,500 per life saved (GiveWell top charities) Helen Keller International (Vitamin A): $3,500 average (2022-2024); varies $1,000-$8,500 by country Against Malaria Foundation: $5,500 per life saved New Incentives (vaccination incentives): $4,500 per life saved Malaria Consortium (seasonal malaria chemoprevention): $3,500 per life saved VAS program details: $2 to provide vitamin A supplements to child for one year Note: Figures accurate for 2024. Helen Keller VAS program has wide country variation ($1K-$8.5K) but $3,500 is accurate average. Among most cost-effective interventions globally Additional sources: https://www.givewell.org/charities/top-charities | https://www.givewell.org/charities/helen-keller-international | https://ourworldindata.org/cost-effectiveness
.
6.
AARP. Unpaid caregiver hours and economic value.
AARP 2023 https://www.aarp.org/caregiving/financial-legal/info-2023/unpaid-caregivers-provide-billions-in-care.html (2023)
Average family caregiver: 25-26 hours per week (100-104 hours per month) 38 million caregivers providing 36 billion hours of care annually Economic value: $16.59 per hour = $600 billion total annual value (2021) 28% of people provided eldercare on a given day, averaging 3.9 hours when providing care Caregivers living with care recipient: 37.4 hours per week Caregivers not living with recipient: 23.7 hours per week Note: Disease-related caregiving is subset of total; includes elderly care, disability care, and child care Additional sources: https://www.aarp.org/caregiving/financial-legal/info-2023/unpaid-caregivers-provide-billions-in-care.html | https://www.bls.gov/news.release/elcare.nr0.htm | https://www.caregiver.org/resource/caregiver-statistics-demographics/
.
7.
CDC MMWR. Childhood vaccination economic benefits.
CDC MMWR https://www.cdc.gov/mmwr/volumes/73/wr/mm7331a2.htm (1994)
US programs (1994-2023): $540B direct savings, $2.7T societal savings ( $18B/year direct, $90B/year societal) Global (2001-2020): $820B value for 10 diseases in 73 countries ( $41B/year) ROI: $11 return per $1 invested Measles vaccination alone saved 93.7M lives (61% of 154M total) over 50 years (1974-2024) Additional sources: https://www.cdc.gov/mmwr/volumes/73/wr/mm7331a2.htm | https://www.thelancet.com/journals/lancet/article/PIIS0140-6736(24)00850-X/fulltext
.
9.
U.S. Bureau of Labor Statistics.
CPI inflation calculator. (2024)
CPI-U (1980): 82.4 CPI-U (2024): 313.5 Inflation multiplier (1980-2024): 3.80× Cumulative inflation: 280.48% Average annual inflation rate: 3.08% Note: Official U.S. government inflation data using Consumer Price Index for All Urban Consumers (CPI-U). Additional sources: https://www.bls.gov/data/inflation_calculator.htm
.
10.
ClinicalTrials.gov API v2 direct analysis. ClinicalTrials.gov cumulative enrollment data (2025).
Direct analysis via ClinicalTrials.gov API v2 https://clinicaltrials.gov/data-api/api Analysis of 100,000 active/recruiting/completed trials on ClinicalTrials.gov (as of January 2025) shows cumulative enrollment of 12.2 million participants: Phase 1 (722k), Phase 2 (2.2M), Phase 3 (6.5M), Phase 4 (2.7M). Median participants per trial: Phase 1 (33), Phase 2 (60), Phase 3 (237), Phase 4 (90). Additional sources: https://clinicaltrials.gov/data-api/api
.
11.
ACS CAN. Clinical trial patient participation rate.
ACS CAN: Barriers to Clinical Trial Enrollment https://www.fightcancer.org/policy-resources/barriers-patient-enrollment-therapeutic-clinical-trials-cancer Only 3-5% of adult cancer patients in US receive treatment within clinical trials About 5% of American adults have ever participated in any clinical trial Oncology: 2-3% of all oncology patients participate Contrast: 50-60% enrollment for pediatric cancer trials (<15 years old) Note: 20% of cancer trials fail due to insufficient enrollment; 11% of research sites enroll zero patients Additional sources: https://www.fightcancer.org/policy-resources/barriers-patient-enrollment-therapeutic-clinical-trials-cancer | https://hints.cancer.gov/docs/Briefs/HINTS_Brief_48.pdf
.
12.
ScienceDaily. Global prevalence of chronic disease.
ScienceDaily: GBD 2015 Study https://www.sciencedaily.com/releases/2015/06/150608081753.htm (2015)
2.3 billion individuals had more than five ailments (2013) Chronic conditions caused 74% of all deaths worldwide (2019), up from 67% (2010) Approximately 1 in 3 adults suffer from multiple chronic conditions (MCCs) Risk factor exposures: 2B exposed to biomass fuel, 1B to air pollution, 1B smokers Projected economic cost: $47 trillion by 2030 Note: 2.3B with 5+ ailments is more accurate than "2B with chronic disease." One-third of all adults globally have multiple chronic conditions Additional sources: https://www.sciencedaily.com/releases/2015/06/150608081753.htm | https://pmc.ncbi.nlm.nih.gov/articles/PMC10830426/ | https://pmc.ncbi.nlm.nih.gov/articles/PMC6214883/
.
13.
C&EN. Annual number of new drugs approved globally: 50.
C&EN https://cen.acs.org/pharmaceuticals/50-new-drugs-received-FDA/103/i2 (2025)
50 new drugs approved annually Additional sources: https://cen.acs.org/pharmaceuticals/50-new-drugs-received-FDA/103/i2 | https://www.fda.gov/drugs/development-approval-process-drugs/novel-drug-approvals-fda
.
14.
Williams, R. J., Tse, T., DiPiazza, K. & Zarin, D. A.
Terminated trials in the ClinicalTrials.gov results database: Evaluation of availability of primary outcome data and reasons for termination.
PLOS One 10, e0127242 (2015)
Approximately 12% of trials with results posted on the ClinicalTrials.gov results database (905/7,646) were terminated. Primary reasons: insufficient accrual (57% of non-data-driven terminations), business/strategic reasons, and efficacy/toxicity findings (21% data-driven terminations).
18.
GiveWell. Cost per DALY for deworming programs.
https://www.givewell.org/international/technical/programs/deworming/cost-effectiveness Schistosomiasis treatment: $28.19-$70.48 per DALY (using arithmetic means with varying disability weights) Soil-transmitted helminths (STH) treatment: $82.54 per DALY (midpoint estimate) Note: GiveWell explicitly states this 2011 analysis is "out of date" and their current methodology focuses on long-term income effects rather than short-term health DALYs Additional sources: https://www.givewell.org/international/technical/programs/deworming/cost-effectiveness
.
19.
Calculated from IHME Global Burden of Disease (2.55B DALYs) and global GDP per capita valuation. $109 trillion annual global disease burden.
The global economic burden of disease, including direct healthcare costs ($8.2 trillion) and lost productivity ($100.9 trillion from 2.55 billion DALYs × $39,570 per DALY), totals approximately $109.1 trillion annually.
21.
Think by Numbers. Pre-1962 drug development costs and timeline (think by numbers).
Think by Numbers: How Many Lives Does FDA Save? https://thinkbynumbers.org/health/how-many-net-lives-does-the-fda-save/ (1962)
Historical estimates (1970-1985): USD $226M fully capitalized (2011 prices) 1980s drugs: $65M after-tax R&D (1990 dollars), $194M compounded to approval (1990 dollars) Modern comparison: $2-3B costs, 7-12 years (dramatic increase from pre-1962) Context: 1962 regulatory clampdown reduced new treatment production by 70%, dramatically increasing development timelines and costs Note: Secondary source; less reliable than Congressional testimony Additional sources: https://thinkbynumbers.org/health/how-many-net-lives-does-the-fda-save/ | https://en.wikipedia.org/wiki/Cost_of_drug_development | https://www.statnews.com/2018/10/01/changing-1962-law-slash-drug-prices/
.
22.
Biotechnology Innovation Organization (BIO). BIO clinical development success rates 2011-2020.
Biotechnology Innovation Organization (BIO) https://go.bio.org/rs/490-EHZ-999/images/ClinicalDevelopmentSuccessRates2011_2020.pdf (2021)
Phase I duration: 2.3 years average Total time to market (Phase I-III + approval): 10.5 years average Phase transition success rates: Phase I→II: 63.2%, Phase II→III: 30.7%, Phase III→Approval: 58.1% Overall probability of approval from Phase I: 12% Note: Largest publicly available study of clinical trial success rates. Efficacy lag = 10.5 - 2.3 = 8.2 years post-safety verification. Additional sources: https://go.bio.org/rs/490-EHZ-999/images/ClinicalDevelopmentSuccessRates2011_2020.pdf
.
23.
Nature Medicine. Drug repurposing rate ( 30%).
Nature Medicine https://www.nature.com/articles/s41591-024-03233-x (2024)
Approximately 30% of drugs gain at least one new indication after initial approval. Additional sources: https://www.nature.com/articles/s41591-024-03233-x
.
24.
EPI. Education investment economic multiplier (2.1).
EPI: Public Investments Outside Core Infrastructure https://www.epi.org/publication/bp348-public-investments-outside-core-infrastructure/ Early childhood education: Benefits 12X outlays by 2050; $8.70 per dollar over lifetime Educational facilities: $1 spent → $1.50 economic returns Energy efficiency comparison: 2-to-1 benefit-to-cost ratio (McKinsey) Private return to schooling: 9% per additional year (World Bank meta-analysis) Note: 2.1 multiplier aligns with benefit-to-cost ratios for educational infrastructure/energy efficiency. Early childhood education shows much higher returns (12X by 2050) Additional sources: https://www.epi.org/publication/bp348-public-investments-outside-core-infrastructure/ | https://documents1.worldbank.org/curated/en/442521523465644318/pdf/WPS8402.pdf | https://freopp.org/whitepapers/establishing-a-practical-return-on-investment-framework-for-education-and-skills-development-to-expand-economic-opportunity/
.
25.
PMC. Healthcare investment economic multiplier (1.8).
PMC: California Universal Health Care https://pmc.ncbi.nlm.nih.gov/articles/PMC5954824/ (2022)
Healthcare fiscal multiplier: 4.3 (95% CI: 2.5-6.1) during pre-recession period (1995-2007) Overall government spending multiplier: 1.61 (95% CI: 1.37-1.86) Why healthcare has high multipliers: No effect on trade deficits (spending stays domestic); improves productivity & competitiveness; enhances long-run potential output Gender-sensitive fiscal spending (health & care economy) produces substantial positive growth impacts Note: "1.8" appears to be conservative estimate; research shows healthcare multipliers of 4.3 Additional sources: https://pmc.ncbi.nlm.nih.gov/articles/PMC5954824/ | https://cepr.org/voxeu/columns/government-investment-and-fiscal-stimulus | https://ncbi.nlm.nih.gov/pmc/articles/PMC3849102/ | https://set.odi.org/wp-content/uploads/2022/01/Fiscal-multipliers-review.pdf
.
26.
World Bank. Infrastructure investment economic multiplier (1.6).
World Bank: Infrastructure Investment as Stimulus https://blogs.worldbank.org/en/ppps/effectiveness-infrastructure-investment-fiscal-stimulus-what-weve-learned (2022)
Infrastructure fiscal multiplier: 1.6 during contractionary phase of economic cycle Average across all economic states: 1.5 (meaning $1 of public investment → $1.50 of economic activity) Time horizon: 0.8 within 1 year, 1.5 within 2-5 years Range of estimates: 1.5-2.0 (following 2008 financial crisis & American Recovery Act) Italian public construction: 1.5-1.9 multiplier US ARRA: 0.4-2.2 range (differential impacts by program type) Economic Policy Institute: Uses 1.6 for infrastructure spending (middle range of estimates) Note: Public investment less likely to crowd out private activity during recessions; particularly effective when monetary policy loose with near-zero rates Additional sources: https://blogs.worldbank.org/en/ppps/effectiveness-infrastructure-investment-fiscal-stimulus-what-weve-learned | https://www.gihub.org/infrastructure-monitor/insights/fiscal-multiplier-effect-of-infrastructure-investment/ | https://cepr.org/voxeu/columns/government-investment-and-fiscal-stimulus | https://www.richmondfed.org/publications/research/economic_brief/2022/eb_22-04
.
27.
Mercatus. Military spending economic multiplier (0.6).
Mercatus: Defense Spending and Economy https://www.mercatus.org/research/research-papers/defense-spending-and-economy Ramey (2011): 0.6 short-run multiplier Barro (1981): 0.6 multiplier for WWII spending (war spending crowded out 40¢ private economic activity per federal dollar) Barro & Redlick (2011): 0.4 within current year, 0.6 over two years; increased govt spending reduces private-sector GDP portions General finding: $1 increase in deficit-financed federal military spending = less than $1 increase in GDP Variation by context: Central/Eastern European NATO: 0.6 on impact, 1.5-1.6 in years 2-3, gradual fall to zero Ramey & Zubairy (2018): Cumulative 1% GDP increase in military expenditure raises GDP by 0.7% Additional sources: https://www.mercatus.org/research/research-papers/defense-spending-and-economy | https://cepr.org/voxeu/columns/world-war-ii-america-spending-deficits-multipliers-and-sacrifice | https://www.rand.org/content/dam/rand/pubs/research_reports/RRA700/RRA739-2/RAND_RRA739-2.pdf
.
28.
FDA. FDA-approved prescription drug products (20,000+).
FDA https://www.fda.gov/media/143704/download There are over 20,000 prescription drug products approved for marketing. Additional sources: https://www.fda.gov/media/143704/download
.
30.
ACLED. Active combat deaths annually.
ACLED: Global Conflict Surged 2024 https://acleddata.com/2024/12/12/data-shows-global-conflict-surged-in-2024-the-washington-post/ (2024)
2024: 233,597 deaths (30% increase from 179,099 in 2023) Deadliest conflicts: Ukraine (67,000), Palestine (35,000) Nearly 200,000 acts of violence (25% higher than 2023, double from 5 years ago) One in six people globally live in conflict-affected areas Additional sources: https://acleddata.com/2024/12/12/data-shows-global-conflict-surged-in-2024-the-washington-post/ | https://acleddata.com/media-citation/data-shows-global-conflict-surged-2024-washington-post | https://acleddata.com/conflict-index/index-january-2024/
.
31.
UCDP. State violence deaths annually.
UCDP: Uppsala Conflict Data Program https://ucdp.uu.se/ Uppsala Conflict Data Program (UCDP): Tracks one-sided violence (organized actors attacking unarmed civilians) UCDP definition: Conflicts causing at least 25 battle-related deaths in calendar year 2023 total organized violence: 154,000 deaths; Non-state conflicts: 20,900 deaths UCDP collects data on state-based conflicts, non-state conflicts, and one-sided violence Specific "2,700 annually" figure for state violence not found in recent UCDP data; actual figures vary annually Additional sources: https://ucdp.uu.se/ | https://en.wikipedia.org/wiki/Uppsala_Conflict_Data_Program | https://ourworldindata.org/grapher/deaths-in-armed-conflicts-by-region
.
32.
Our World in Data. Terror attack deaths (8,300 annually).
Our World in Data: Terrorism https://ourworldindata.org/terrorism (2024)
2023: 8,352 deaths (22% increase from 2022, highest since 2017) 2023: 3,350 terrorist incidents (22% decrease), but 56% increase in avg deaths per attack Global Terrorism Database (GTD): 200,000+ terrorist attacks recorded (2021 version) Maintained by: National Consortium for Study of Terrorism & Responses to Terrorism (START), U. of Maryland Geographic shift: Epicenter moved from Middle East to Central Sahel (sub-Saharan Africa) - now >50% of all deaths Additional sources: https://ourworldindata.org/terrorism | https://reliefweb.int/report/world/global-terrorism-index-2024 | https://www.start.umd.edu/gtd/ | https://ourworldindata.org/grapher/fatalities-from-terrorism
.
33.
Institute for Health Metrics and Evaluation (IHME). IHME global burden of disease 2021 (2.88B DALYs, 1.13B YLD).
Institute for Health Metrics and Evaluation (IHME) https://vizhub.healthdata.org/gbd-results/ (2024)
In 2021, global DALYs totaled approximately 2.88 billion, comprising 1.75 billion Years of Life Lost (YLL) and 1.13 billion Years Lived with Disability (YLD). This represents a 13% increase from 2019 (2.55B DALYs), largely attributable to COVID-19 deaths and aging populations. YLD accounts for approximately 39% of total DALYs, reflecting the substantial burden of non-fatal chronic conditions. Additional sources: https://vizhub.healthdata.org/gbd-results/ | https://www.thelancet.com/journals/lancet/article/PIIS0140-6736(24)00757-8/fulltext | https://www.healthdata.org/research-analysis/about-gbd
.
34.
Costs of War Project, Brown University Watson Institute. Environmental cost of war ($100B annually).
Brown Watson Costs of War: Environmental Cost https://watson.brown.edu/costsofwar/costs/social/environment War on Terror emissions: 1.2B metric tons GHG (equivalent to 257M cars/year) Military: 5.5% of global GHG emissions (2X aviation + shipping combined) US DoD: World’s single largest institutional oil consumer, 47th largest emitter if nation Cleanup costs: $500B+ for military contaminated sites Gaza war environmental damage: $56.4B; landmine clearance: $34.6B expected Climate finance gap: Rich nations spend 30X more on military than climate finance Note: Military activities cause massive environmental damage through GHG emissions, toxic contamination, and long-term cleanup costs far exceeding current climate finance commitments Additional sources: https://watson.brown.edu/costsofwar/costs/social/environment | https://earth.org/environmental-costs-of-wars/ | https://transformdefence.org/transformdefence/stats/
.
35.
ScienceDaily. Medical research lives saved annually (4.2 million).
ScienceDaily: Physical Activity Prevents 4M Deaths https://www.sciencedaily.com/releases/2020/06/200617194510.htm (2020)
Physical activity: 3.9M early deaths averted annually worldwide (15% lower premature deaths than without) COVID vaccines (2020-2024): 2.533M deaths averted, 14.8M life-years preserved; first year alone: 14.4M deaths prevented Cardiovascular prevention: 3 interventions could delay 94.3M deaths over 25 years (antihypertensives alone: 39.4M) Pandemic research response: Millions of deaths averted through rapid vaccine/drug development Additional sources: https://www.sciencedaily.com/releases/2020/06/200617194510.htm | https://pmc.ncbi.nlm.nih.gov/articles/PMC9537923/ | https://www.ahajournals.org/doi/10.1161/CIRCULATIONAHA.118.038160 | https://pmc.ncbi.nlm.nih.gov/articles/PMC9464102/
.
36.
SIPRI. 36:1 disparity ratio of spending on weapons over cures.
SIPRI: Military Spending https://www.sipri.org/commentary/blog/2016/opportunity-cost-world-military-spending (2016)
Global military spending: $2.7 trillion (2024, SIPRI) Global government medical research: $68 billion (2024) Actual ratio: 39.7:1 in favor of weapons over medical research Military R&D alone: $85B (2004 data, 10% of global R&D) Military spending increases crowd out health: 1% ↑ military = 0.62% ↓ health spending Note: Ratio actually worse than 36:1. Each 1% increase in military spending reduces health spending by 0.62%, with effect more intense in poorer countries (0.962% reduction) Additional sources: https://www.sipri.org/commentary/blog/2016/opportunity-cost-world-military-spending | https://pmc.ncbi.nlm.nih.gov/articles/PMC9174441/ | https://www.congress.gov/crs-product/R45403
.
37.
Think by Numbers. Lost human capital due to war ($270B annually).
Think by Numbers https://thinkbynumbers.org/military/war/the-economic-case-for-peace-a-comprehensive-financial-analysis/ (2021)
Lost human capital from war: $300B annually (economic impact of losing skilled/productive individuals to conflict) Broader conflict/violence cost: $14T/year globally 1.4M violent deaths/year; conflict holds back economic development, causes instability, widens inequality, erodes human capital 2002: 48.4M DALYs lost from 1.6M violence deaths = $151B economic value (2000 USD) Economic toll includes: commodity prices, inflation, supply chain disruption, declining output, lost human capital Additional sources: https://thinkbynumbers.org/military/war/the-economic-case-for-peace-a-comprehensive-financial-analysis/ | https://www.weforum.org/stories/2021/02/war-violence-costs-each-human-5-a-day/ | https://pubmed.ncbi.nlm.nih.gov/19115548/
.
38.
PubMed. Psychological impact of war cost ($100B annually).
PubMed: Economic Burden of PTSD https://pubmed.ncbi.nlm.nih.gov/35485933/ PTSD economic burden (2018 U.S.): $232.2B total ($189.5B civilian, $42.7B military) Civilian costs driven by: Direct healthcare ($66B), unemployment ($42.7B) Military costs driven by: Disability ($17.8B), direct healthcare ($10.1B) Exceeds costs of other mental health conditions (anxiety, depression) War-exposed populations: 2-3X higher rates of anxiety, depression, PTSD; women and children most vulnerable Note: Actual burden $232B, significantly higher than "$100B" claimed Additional sources: https://pubmed.ncbi.nlm.nih.gov/35485933/ | https://news.va.gov/103611/study-national-economic-burden-of-ptsd-staggering/ | https://pmc.ncbi.nlm.nih.gov/articles/PMC9957523/
.
39.
CGDev. UNHCR average refugee support cost.
CGDev https://www.cgdev.org/blog/costs-hosting-refugees-oecd-countries-and-why-uk-outlier (2024)
The average cost of supporting a refugee is $1,384 per year. This represents total host country costs (housing, healthcare, education, security). OECD countries average $6,100 per refugee (mean 2022-2023), with developing countries spending $700-1,000. Global weighted average of $1,384 is reasonable given that 75-85% of refugees are in low/middle-income countries. Additional sources: https://www.cgdev.org/blog/costs-hosting-refugees-oecd-countries-and-why-uk-outlier | https://www.unhcr.org/sites/default/files/2024-11/UNHCR-WB-global-cost-of-refugee-inclusion-in-host-country-health-systems.pdf
.
40.
World Bank. World bank trade disruption cost from conflict.
World Bank https://www.worldbank.org/en/topic/trade/publication/trading-away-from-conflict Estimated $616B annual cost from conflict-related trade disruption. World Bank research shows civil war costs an average developing country 30 years of GDP growth, with 20 years needed for trade to return to pre-war levels. Trade disputes analysis shows tariff escalation could reduce global exports by up to $674 billion. Additional sources: https://www.worldbank.org/en/topic/trade/publication/trading-away-from-conflict | https://www.nber.org/papers/w11565 | http://blogs.worldbank.org/en/trade/impacts-global-trade-and-income-current-trade-disputes
.
41.
VA. Veteran healthcare cost projections.
VA https://department.va.gov/wp-content/uploads/2025/06/2026-Budget-in-Brief.pdf (2026)
VA budget: $441.3B requested for FY 2026 (10% increase). Disability compensation: $165.6B in FY 2024 for 6.7M veterans. PACT Act projected to increase spending by $300B between 2022-2031. Costs under Toxic Exposures Fund: $20B (2024), $30.4B (2025), $52.6B (2026). Additional sources: https://department.va.gov/wp-content/uploads/2025/06/2026-Budget-in-Brief.pdf | https://www.cbo.gov/publication/45615 | https://www.legion.org/information-center/news/veterans-healthcare/2025/june/va-budget-tops-400-billion-for-2025-from-higher-spending-on-mandated-benefits-medical-care
.
45.
Applied Clinical Trials. Global government spending on interventional clinical trials: $3-6 billion/year.
Applied Clinical Trials https://www.appliedclinicaltrialsonline.com/view/sizing-clinical-research-market Estimated range based on NIH ( $0.8-5.6B), NIHR ($1.6B total budget), and EU funding ( $1.3B/year). Roughly 5-10% of global market. Additional sources: https://www.appliedclinicaltrialsonline.com/view/sizing-clinical-research-market | https://www.thelancet.com/journals/langlo/article/PIIS2214-109X(20)30357-0/fulltext
.
49.
Estimated from major foundation budgets and activities. Nonprofit clinical trial funding estimate.
Nonprofit foundations spend an estimated $2-5 billion annually on clinical trials globally, representing approximately 2-5% of total clinical trial spending.
50.
Industry reports: IQVIA. Global pharmaceutical r&d spending.
Total global pharmaceutical R&D spending is approximately $300 billion annually. Clinical trials represent 15-20% of this total ($45-60B), with the remainder going to drug discovery, preclinical research, regulatory affairs, and manufacturing development.
51.
UN. Global population reaches 8 billion.
UN: World Population 8 Billion Nov 15 2022 https://www.un.org/en/desa/world-population-reach-8-billion-15-november-2022 (2022)
Milestone: November 15, 2022 (UN World Population Prospects 2022) Day of Eight Billion" designated by UN Added 1 billion people in just 11 years (2011-2022) Growth rate: Slowest since 1950; fell under 1% in 2020 Future: 15 years to reach 9B (2037); projected peak 10.4B in 2080s Projections: 8.5B (2030), 9.7B (2050), 10.4B (2080-2100 plateau) Note: Milestone reached Nov 2022. Population growth slowing; will take longer to add next billion (15 years vs 11 years) Additional sources: https://www.un.org/en/desa/world-population-reach-8-billion-15-november-2022 | https://www.un.org/en/dayof8billion | https://en.wikipedia.org/wiki/Day_of_Eight_Billion
.
52.
Harvard Kennedy School. 3.5% participation tipping point.
Harvard Kennedy School https://www.hks.harvard.edu/centers/carr/publications/35-rule-how-small-minority-can-change-world (2020)
The research found that nonviolent campaigns were twice as likely to succeed as violent ones, and once 3.5% of the population were involved, they were always successful. Chenoweth and Maria Stephan studied the success rates of civil resistance efforts from 1900 to 2006, finding that nonviolent movements attracted, on average, four times as many participants as violent movements and were more likely to succeed. Key finding: Every campaign that mobilized at least 3.5% of the population in sustained protest was successful (in their 1900-2006 dataset) Note: The 3.5% figure is a descriptive statistic from historical analysis, not a guaranteed threshold. One exception (Bahrain 2011-2014 with 6%+ participation) has been identified. The rule applies to regime change, not policy change in democracies. Additional sources: https://www.hks.harvard.edu/centers/carr/publications/35-rule-how-small-minority-can-change-world | https://www.hks.harvard.edu/sites/default/files/2024-05/Erica%20Chenoweth_2020-005.pdf | https://www.bbc.com/future/article/20190513-it-only-takes-35-of-people-to-change-the-world | https://en.wikipedia.org/wiki/3.5%25_rule
.
53.
NHGRI. Human genome project and CRISPR discovery.
NHGRI https://www.genome.gov/11006929/2003-release-international-consortium-completes-hgp (2003)
Your DNA is 3 billion base pairs Read the entire code (Human Genome Project, completed 2003) Learned to edit it (CRISPR, discovered 2012) Additional sources: https://www.genome.gov/11006929/2003-release-international-consortium-completes-hgp | https://www.nobelprize.org/prizes/chemistry/2020/press-release/
.
54.
PMC. Only 12% of human interactome targeted.
PMC https://pmc.ncbi.nlm.nih.gov/articles/PMC10749231/ (2023)
Mapping 350,000+ clinical trials showed that only 12% of the human interactome has ever been targeted by drugs. Additional sources: https://pmc.ncbi.nlm.nih.gov/articles/PMC10749231/
.
55.
WHO. ICD-10 code count ( 14,000).
WHO https://icd.who.int/browse10/2019/en (2019)
The ICD-10 classification contains approximately 14,000 codes for diseases, signs and symptoms. Additional sources: https://icd.who.int/browse10/2019/en
.
56.
Wikipedia. Longevity escape velocity (LEV) - maximum human life extension potential.
Wikipedia: Longevity Escape Velocity https://en.wikipedia.org/wiki/Longevity_escape_velocity Longevity escape velocity: Hypothetical point where medical advances extend life expectancy faster than time passes Term coined by Aubrey de Grey (biogerontologist) in 2004 paper; concept from David Gobel (Methuselah Foundation) Current progress: Science adds 3 months to lifespan per year; LEV requires adding >1 year per year Sinclair (Harvard): "There is no biological upper limit to age" - first person to live to 150 may already be born De Grey: 50% chance of reaching LEV by mid-to-late 2030s; SENS approach = damage repair rather than slowing damage Kurzweil (2024): LEV by 2029-2035, AI will simulate biological processes to accelerate solutions George Church: LEV "in a decade or two" via age-reversal clinical trials Natural lifespan cap: 120-150 years (Jeanne Calment record: 122); engineering approach could bypass via damage repair Key mechanisms: Epigenetic reprogramming, senolytic drugs, stem cell therapy, gene therapy, AI-driven drug discovery Current record: Jeanne Calment (122 years, 164 days) - record unbroken since 1997 Note: LEV is theoretical but increasingly plausible given demonstrated age reversal in mice (109% lifespan extension) and human cells (30-year epigenetic age reversal) Additional sources: https://en.wikipedia.org/wiki/Longevity_escape_velocity | https://pmc.ncbi.nlm.nih.gov/articles/PMC423155/ | https://www.popularmechanics.com/science/a36712084/can-science-cure-death-longevity/ | https://www.diamandis.com/blog/longevity-escape-velocity
.
57.
OpenSecrets. Lobbyist statistics for washington d.c.
OpenSecrets: Lobbying in US https://en.wikipedia.org/wiki/Lobbying_in_the_United_States Registered lobbyists: Over 12,000 (some estimates); 12,281 registered (2013) Former government employees as lobbyists: 2,200+ former federal employees (1998-2004), including 273 former White House staffers, 250 former Congress members & agency heads Congressional revolving door: 43% (86 of 198) lawmakers who left 1998-2004 became lobbyists; currently 59% leaving to private sector work for lobbying/consulting firms/trade groups Executive branch: 8% were registered lobbyists at some point before/after government service Additional sources: https://en.wikipedia.org/wiki/Lobbying_in_the_United_States | https://www.opensecrets.org/revolving-door | https://www.citizen.org/article/revolving-congress/ | https://www.propublica.org/article/we-found-a-staggering-281-lobbyists-whove-worked-in-the-trump-administration
.
58.
MDPI Vaccines. Measles vaccination ROI.
MDPI Vaccines https://www.mdpi.com/2076-393X/12/11/1210 (2024)
Single measles vaccination: 167:1 benefit-cost ratio. MMR (measles-mumps-rubella) vaccination: 14:1 ROI. Historical US elimination efforts (1966-1974): benefit-cost ratio of 10.3:1 with net benefits exceeding USD 1.1 billion (1972 dollars, or USD 8.0 billion in 2023 dollars). 2-dose MMR programs show direct benefit/cost ratio of 14.2 with net savings of $5.3 billion, and 26.0 from societal perspectives with net savings of $11.6 billion. Additional sources: https://www.mdpi.com/2076-393X/12/11/1210 | https://www.tandfonline.com/doi/full/10.1080/14760584.2024.2367451
.
62.
Calculated from Orphanet Journal of Rare Diseases (2024). Diseases getting first effective treatment each year.
Calculated from Orphanet Journal of Rare Diseases (2024) https://ojrd.biomedcentral.com/articles/10.1186/s13023-024-03398-1 (2024)
Under the current system, approximately 10-15 diseases per year receive their FIRST effective treatment. Calculation: 5% of 7,000 rare diseases ( 350) have FDA-approved treatment, accumulated over 40 years of the Orphan Drug Act = 9 rare diseases/year. Adding 5-10 non-rare diseases that get first treatments yields 10-20 total. FDA approves 50 drugs/year, but many are for diseases that already have treatments (me-too drugs, second-line therapies). Only 15 represent truly FIRST treatments for previously untreatable conditions.
63.
NIH. NIH budget (FY 2025).
NIH https://www.nih.gov/about-nih/organization/budget (2024)
The budget total of $47.7 billion also includes $1.412 billion derived from PHS Evaluation financing... Additional sources: https://www.nih.gov/about-nih/organization/budget | https://officeofbudget.od.nih.gov/
.
64.
Bentley et al. NIH spending on clinical trials: 3.3%.
Bentley et al. https://pmc.ncbi.nlm.nih.gov/articles/PMC10349341/ (2023)
NIH spent $8.1 billion on clinical trials for approved drugs (2010-2019), representing 3.3% of relevant NIH spending. Additional sources: https://pmc.ncbi.nlm.nih.gov/articles/PMC10349341/ | https://catalyst.harvard.edu/news/article/nih-spent-8-1b-for-phased-clinical-trials-of-drugs-approved-2010-19-10-of-reported-industry-spending/
.
65.
PMC. Standard medical research ROI ($20k-$100k/QALY).
PMC: Cost-effectiveness Thresholds Used by Study Authors https://pmc.ncbi.nlm.nih.gov/articles/PMC10114019/ (1990)
Typical cost-effectiveness thresholds for medical interventions in rich countries range from $50,000 to $150,000 per QALY. The Institute for Clinical and Economic Review (ICER) uses a $100,000-$150,000/QALY threshold for value-based pricing. Between 1990-2021, authors increasingly cited $100,000 (47% by 2020-21) or $150,000 (24% by 2020-21) per QALY as benchmarks for cost-effectiveness. Additional sources: https://pmc.ncbi.nlm.nih.gov/articles/PMC10114019/ | https://icer.org/our-approach/methods-process/cost-effectiveness-the-qaly-and-the-evlyg/
.
66.
Manhattan Institute. RECOVERY trial 82× cost reduction.
Manhattan Institute: Slow Costly Trials https://manhattan.institute/article/slow-costly-clinical-trials-drag-down-biomedical-breakthroughs RECOVERY trial: $500 per patient ($20M for 48,000 patients = $417/patient) Typical clinical trial: $41,000 median per-patient cost Cost reduction: 80-82× cheaper ($41,000 ÷ $500 ≈ 82×) Efficiency: $50 per patient per answer (10 therapeutics tested, 4 effective) Dexamethasone estimated to save >630,000 lives Additional sources: https://manhattan.institute/article/slow-costly-clinical-trials-drag-down-biomedical-breakthroughs | https://pmc.ncbi.nlm.nih.gov/articles/PMC9293394/
.
67.
Trials. Patient willingness to participate in clinical trials.
Trials: Patients’ Willingness Survey https://trialsjournal.biomedcentral.com/articles/10.1186/s13063-015-1105-3 Recent surveys: 49-51% willingness (2020-2022) - dramatic drop from 85% (2019) during COVID-19 pandemic Cancer patients when approached: 88% consented to trials (Royal Marsden Hospital) Study type variation: 44.8% willing for drug trial, 76.2% for diagnostic study Top motivation: "Learning more about my health/medical condition" (67.4%) Top barrier: "Worry about experiencing side effects" (52.6%) Additional sources: https://trialsjournal.biomedcentral.com/articles/10.1186/s13063-015-1105-3 | https://www.appliedclinicaltrialsonline.com/view/industry-forced-to-rethink-patient-participation-in-trials | https://pmc.ncbi.nlm.nih.gov/articles/PMC7183682/
.
68.
Tufts CSDD. Cost of drug development.
Various estimates suggest $1.0 - $2.5 billion to bring a new drug from discovery through FDA approval, spread across 10 years. Tufts Center for the Study of Drug Development often cited for $1.0 - $2.6 billion/drug. Industry reports (IQVIA, Deloitte) also highlight $2+ billion figures.
69.
Value in Health. Average lifetime revenue per successful drug.
Value in Health: Sales Revenues for New Therapeutic Agents https://www.sciencedirect.com/science/article/pii/S1098301524027542 Study of 361 FDA-approved drugs from 1995-2014 (median follow-up 13.2 years): Mean lifetime revenue: $15.2 billion per drug Median lifetime revenue: $6.7 billion per drug Revenue after 5 years: $3.2 billion (mean) Revenue after 10 years: $9.5 billion (mean) Revenue after 15 years: $19.2 billion (mean) Distribution highly skewed: top 25 drugs (7%) accounted for 38% of total revenue ($2.1T of $5.5T) Additional sources: https://www.sciencedirect.com/science/article/pii/S1098301524027542
.
70.
Lichtenberg, F. R.
How many life-years have new drugs saved? A three-way fixed-effects analysis of 66 diseases in 27 countries, 2000-2013.
International Health 11, 403–416 (2019)
Using 3-way fixed-effects methodology (disease-country-year) across 66 diseases in 22 countries, this study estimates that drugs launched after 1981 saved 148.7 million life-years in 2013 alone. The regression coefficients for drug launches 0-11 years prior (beta=-0.031, SE=0.008) and 12+ years prior (beta=-0.057, SE=0.013) on years of life lost are highly significant (p<0.0001). Confidence interval for life-years saved: 79.4M-239.8M (95 percent CI) based on propagated standard errors from Table 2.
71.
Deloitte. Pharmaceutical r&d return on investment (ROI).
Deloitte: Measuring Pharmaceutical Innovation 2025 https://www.deloitte.com/ch/en/Industries/life-sciences-health-care/research/measuring-return-from-pharmaceutical-innovation.html (2025)
Deloitte’s annual study of top 20 pharma companies by R&D spend (2010-2024): 2024 ROI: 5.9% (second year of growth after decade of decline) 2023 ROI: 4.3% (estimated from trend) 2022 ROI: 1.2% (historic low since study began, 13-year low) 2021 ROI: 6.8% (record high, inflated by COVID-19 vaccines/treatments) Long-term trend: Declining for over a decade before 2023 recovery Average R&D cost per asset: $2.3B (2022), $2.23B (2024) These returns (1.2-5.9% range) fall far below typical corporate ROI targets (15-20%) Additional sources: https://www.deloitte.com/ch/en/Industries/life-sciences-health-care/research/measuring-return-from-pharmaceutical-innovation.html | https://www.prnewswire.com/news-releases/deloittes-13th-annual-pharmaceutical-innovation-report-pharma-rd-return-on-investment-falls-in-post-pandemic-market-301738807.html | https://hitconsultant.net/2023/02/16/pharma-rd-roi-falls-to-lowest-level-in-13-years/
.
72.
Nature Reviews Drug Discovery. Drug trial success rate from phase i to approval.
Nature Reviews Drug Discovery: Clinical Success Rates https://www.nature.com/articles/nrd.2016.136 (2016)
Overall Phase I to approval: 10-12.8% (conventional wisdom 10%, studies show 12.8%) Recent decline: Average LOA now 6.7% for Phase I (2014-2023 data) Leading pharma companies: 14.3% average LOA (range 8-23%) Varies by therapeutic area: Oncology 3.4%, CNS/cardiovascular lowest at Phase III Phase-specific success: Phase I 47-54%, Phase II 28-34%, Phase III 55-70% Note: 12% figure accurate for historical average. Recent data shows decline to 6.7%, with Phase II as primary attrition point (28% success) Additional sources: https://www.nature.com/articles/nrd.2016.136 | https://pmc.ncbi.nlm.nih.gov/articles/PMC6409418/ | https://academic.oup.com/biostatistics/article/20/2/273/4817524
.
73.
SofproMed. Phase 3 cost per trial range.
SofproMed https://www.sofpromed.com/how-much-does-a-clinical-trial-cost Phase 3 clinical trials cost between $20 million and $282 million per trial, with significant variation by therapeutic area and trial complexity. Additional sources: https://www.sofpromed.com/how-much-does-a-clinical-trial-cost | https://www.cbo.gov/publication/57126
.
74.
Ramsberg, J. & Platt, R. Pragmatic trial cost per patient (median $97).
Learning Health Systems https://pmc.ncbi.nlm.nih.gov/articles/PMC6508852/ (2018)
Meta-analysis of 108 embedded pragmatic clinical trials (2006-2016). The median cost per patient was $97 (IQR $19–$478), based on 2015 dollars. 25% of trials cost <$19/patient; 10 trials exceeded $1,000/patient. U.S. studies median $187 vs non-U.S. median $27. Additional sources: https://pmc.ncbi.nlm.nih.gov/articles/PMC6508852/
.
75.
WHO. Polio vaccination ROI.
WHO https://www.who.int/news-room/feature-stories/detail/sustaining-polio-investments-offers-a-high-return (2019)
For every dollar spent, the return on investment is nearly US$ 39." Total investment cost of US$ 7.5 billion generates projected economic and social benefits of US$ 289.2 billion from sustaining polio assets and integrating them into expanded immunization, surveillance and emergency response programmes across 8 priority countries (Afghanistan, Iraq, Libya, Pakistan, Somalia, Sudan, Syria, Yemen). Additional sources: https://www.who.int/news-room/feature-stories/detail/sustaining-polio-investments-offers-a-high-return
.
76.
ICRC. International campaign to ban landmines (ICBL) - ottawa treaty (1997).
ICRC https://www.icrc.org/en/doc/resources/documents/article/other/57jpjn.htm (1997)
ICBL: Founded 1992 by 6 NGOs (Handicap International, Human Rights Watch, Medico International, Mines Advisory Group, Physicians for Human Rights, Vietnam Veterans of America Foundation) Started with ONE staff member: Jody Williams as founding coordinator Grew to 1,000+ organizations in 60 countries by 1997 Ottawa Process: 14 months (October 1996 - December 1997) Convention signed by 122 states on December 3, 1997; entered into force March 1, 1999 Achievement: Nobel Peace Prize 1997 (shared by ICBL and Jody Williams) Government funding context: Canada established $100M CAD Canadian Landmine Fund over 10 years (1997); International donors provided $169M in 1997 for mine action (up from $100M in 1996) Additional sources: https://www.icrc.org/en/doc/resources/documents/article/other/57jpjn.htm | https://en.wikipedia.org/wiki/International_Campaign_to_Ban_Landmines | https://www.nobelprize.org/prizes/peace/1997/summary/ | https://un.org/press/en/1999/19990520.MINES.BRF.html | https://www.the-monitor.org/en-gb/reports/2003/landmine-monitor-2003/mine-action-funding.aspx
.
77.
OpenSecrets.
Revolving door: Former members of congress. (2024)
388 former members of Congress are registered as lobbyists. Nearly 5,400 former congressional staffers have left Capitol Hill to become federal lobbyists in the past 10 years. Additional sources: https://www.opensecrets.org/revolving-door
.
78.
Kinch, M. S. & Griesenauer, R. H.
Lost medicines: A longer view of the pharmaceutical industry with the potential to reinvigorate discovery.
Drug Discovery Today 24, 875–880 (2019)
Research identified 1,600+ medicines available in 1962. The 1950s represented industry high-water mark with >30 new products in five of ten years; this rate would not be replicated until late 1990s. More than half (880) of these medicines were lost following implementation of Kefauver-Harris Amendment. The peak of 1962 would not be seen again until early 21st century. By 2016 number of organizations actively involved in R&D at level not seen since 1914.
79.
Baily, M. N. Pre-1962 drug development costs (baily 1972).
Baily (1972) https://samizdathealth.org/wp-content/uploads/2020/12/hlthaff.1.2.6.pdf (1972)
Pre-1962: Average cost per new chemical entity (NCE) was $6.5 million (1980 dollars) Inflation-adjusted to 2024 dollars: $6.5M (1980) ≈ $22.5M (2024), using CPI multiplier of 3.46× Real cost increase (inflation-adjusted): $22.5M (pre-1962) → $2,600M (2024) = 116× increase Note: This represents the most comprehensive academic estimate of pre-1962 drug development costs based on empirical industry data Additional sources: https://samizdathealth.org/wp-content/uploads/2020/12/hlthaff.1.2.6.pdf
.
80.
Think by Numbers. Pre-1962 physician-led clinical trials.
Think by Numbers: How Many Lives Does FDA Save? https://thinkbynumbers.org/health/how-many-net-lives-does-the-fda-save/ (1966)
Pre-1962: Physicians could report real-world evidence directly 1962 Drug Amendments replaced "premarket notification" with "premarket approval", requiring extensive efficacy testing Impact: New regulatory clampdown reduced new treatment production by 70%; lifespan growth declined from 4 years/decade to 2 years/decade Drug Efficacy Study Implementation (DESI): NAS/NRC evaluated 3,400+ drugs approved 1938-1962 for safety only; reviewed >3,000 products, >16,000 therapeutic claims FDA has had authority to accept real-world evidence since 1962, clarified by 21st Century Cures Act (2016) Note: Specific "144,000 physicians" figure not verified in sources Additional sources: https://thinkbynumbers.org/health/how-many-net-lives-does-the-fda-save/ | https://www.fda.gov/drugs/enforcement-activities-fda/drug-efficacy-study-implementation-desi | http://www.nasonline.org/about-nas/history/archives/collections/des-1966-1969-1.html
.
81.
GAO. 95% of diseases have 0 FDA-approved treatments.
GAO https://www.gao.gov/products/gao-25-106774 (2025)
95% of diseases have no treatment Additional sources: https://www.gao.gov/products/gao-25-106774 | https://globalgenes.org/rare-disease-facts/
.
83.
NHS England; Águas et al. RECOVERY trial global lives saved ( 1 million).
NHS England: 1 Million Lives Saved https://www.england.nhs.uk/2021/03/covid-treatment-developed-in-the-nhs-saves-a-million-lives/ (2021)
Dexamethasone saved 1 million lives worldwide (NHS England estimate, March 2021, 9 months after discovery). UK alone: 22,000 lives saved. Methodology: Águas et al. Nature Communications 2021 estimated 650,000 lives (range: 240,000-1,400,000) for July-December 2020 alone, based on RECOVERY trial mortality reductions (36% for ventilated, 18% for oxygen-only patients) applied to global COVID hospitalizations. June 2020 announcement: Dexamethasone reduced deaths by up to 1/3 (ventilated patients), 1/5 (oxygen patients). Impact immediate: Adopted into standard care globally within hours of announcement. Additional sources: https://www.england.nhs.uk/2021/03/covid-treatment-developed-in-the-nhs-saves-a-million-lives/ | https://www.nature.com/articles/s41467-021-21134-2 | https://pharmaceutical-journal.com/article/news/steroid-has-saved-the-lives-of-one-million-covid-19-patients-worldwide-figures-show | https://www.recoverytrial.net/news/recovery-trial-celebrates-two-year-anniversary-of-life-saving-dexamethasone-result
.
84.
National September 11 Memorial & Museum.
September 11 attack facts. (2024)
2,977 people were killed in the September 11, 2001 attacks: 2,753 at the World Trade Center, 184 at the Pentagon, and 40 passengers and crew on United Flight 93 in Shanksville, Pennsylvania.
85.
World Bank. World bank singapore economic data.
World Bank https://data.worldbank.org/country/singapore (2024)
Singapore GDP per capita (2023): $82,000 - among highest in the world Government spending: 15% of GDP (vs US 38%) Life expectancy: 84.1 years (vs US 77.5 years) Singapore demonstrates that low government spending can coexist with excellent outcomes Additional sources: https://data.worldbank.org/country/singapore
.
86.
International Monetary Fund.
IMF singapore government spending data. (2024)
Singapore government spending is approximately 15% of GDP This is 23 percentage points lower than the United States (38%) Despite lower spending, Singapore achieves excellent outcomes: - Life expectancy: 84.1 years (vs US 77.5) - Low crime, world-class infrastructure, AAA credit rating Additional sources: https://www.imf.org/en/Countries/SGP
.
87.
World Health Organization.
WHO life expectancy data by country. (2024)
Life expectancy at birth varies significantly among developed nations: Switzerland: 84.0 years (2023) Singapore: 84.1 years (2023) Japan: 84.3 years (2023) United States: 77.5 years (2023) - 6.5 years below Switzerland, Singapore Global average: 73 years Note: US spends more per capita on healthcare than any other nation, yet achieves lower life expectancy Additional sources: https://www.who.int/data/gho/data/themes/mortality-and-global-health-estimates/ghe-life-expectancy-and-healthy-life-expectancy
.
89.
PMC. Contribution of smoking reduction to life expectancy gains.
PMC: Benefits Smoking Cessation Longevity https://www.ncbi.nlm.nih.gov/pmc/articles/PMC1447499/ (2012)
Population-level: Up to 14% (9% men, 14% women) of total life expectancy gain since 1960 due to tobacco control efforts Individual cessation benefits: Quitting at age 35 adds 6.9-8.5 years (men), 6.1-7.7 years (women) vs continuing smokers By cessation age: Age 25-34 = 10 years gained; age 35-44 = 9 years; age 45-54 = 6 years; age 65 = 2.0 years (men), 3.7 years (women) Cessation before age 40: Reduces death risk by 90% Long-term cessation: 10+ years yields survival comparable to never smokers, averts 10 years of life lost Recent cessation: <3 years averts 5 years of life lost Additional sources: https://www.ncbi.nlm.nih.gov/pmc/articles/PMC1447499/ | https://www.cdc.gov/pcd/issues/2012/11_0295.htm | https://www.ajpmonline.org/article/S0749-3797(24)00217-4/fulltext | https://www.nejm.org/doi/full/10.1056/NEJMsa1211128
.
90.
ICER. Value per QALY (standard economic value).
ICER https://icer.org/wp-content/uploads/2024/02/Reference-Case-4.3.25.pdf (2024)
Standard economic value per QALY: $100,000–$150,000. This is the US and global standard willingness-to-pay threshold for interventions that add costs. Dominant interventions (those that save money while improving health) are favorable regardless of this threshold. Additional sources: https://icer.org/wp-content/uploads/2024/02/Reference-Case-4.3.25.pdf
.
91.
GAO. Annual cost of u.s. Sugar subsidies.
GAO: Sugar Program https://www.gao.gov/products/gao-24-106144 Consumer costs: $2.5-3.5 billion per year (GAO estimate) Net economic cost: $1 billion per year 2022: US consumers paid 2X world price for sugar Program costs $3-4 billion/year but no federal budget impact (costs passed directly to consumers via higher prices) Employment impact: 10,000-20,000 manufacturing jobs lost annually in sugar-reliant industries (confectionery, etc.) Multiple studies confirm: Sweetener Users Association ($2.9-3.5B), AEI ($2.4B consumer cost), Beghin & Elobeid ($2.9-3.5B consumer surplus) Additional sources: https://www.gao.gov/products/gao-24-106144 | https://www.heritage.org/agriculture/report/the-us-sugar-program-bad-consumers-bad-agriculture-and-bad-america | https://www.aei.org/articles/the-u-s-spends-4-billion-a-year-subsidizing-stalinist-style-domestic-sugar-production/
.
92.
World Bank. Swiss military budget as percentage of GDP.
World Bank: Military Expenditure https://data.worldbank.org/indicator/MS.MIL.XPND.GD.ZS?locations=CH 2023: 0.70272% of GDP (World Bank) 2024: CHF 5.95 billion official military spending When including militia system costs: 1% GDP (CHF 8.75B) Comparison: Near bottom in Europe; only Ireland, Malta, Moldova spend less (excluding microstates with no armies) Additional sources: https://data.worldbank.org/indicator/MS.MIL.XPND.GD.ZS?locations=CH | https://www.avenir-suisse.ch/en/blog-defence-spending-switzerland-is-in-better-shape-than-it-seems/ | https://tradingeconomics.com/switzerland/military-expenditure-percent-of-gdp-wb-data.html
.
93.
World Bank. Switzerland vs. US GDP per capita comparison.
World Bank: Switzerland GDP Per Capita https://data.worldbank.org/indicator/NY.GDP.PCAP.CD?locations=CH 2024 GDP per capita (PPP-adjusted): Switzerland $93,819 vs United States $75,492 Switzerland’s GDP per capita 24% higher than US when adjusted for purchasing power parity Nominal 2024: Switzerland $103,670 vs US $85,810 Additional sources: https://data.worldbank.org/indicator/NY.GDP.PCAP.CD?locations=CH | https://tradingeconomics.com/switzerland/gdp-per-capita-ppp | https://www.theglobaleconomy.com/USA/gdp_per_capita_ppp/
.
94.
OECD.
OECD government spending as percentage of GDP. (2024)
OECD government spending data shows significant variation among developed nations: United States: 38.0% of GDP (2023) Switzerland: 35.0% of GDP - 3 percentage points lower than US Singapore: 15.0% of GDP - 23 percentage points lower than US (per IMF data) OECD average: approximately 40% of GDP Additional sources: https://data.oecd.org/gga/general-government-spending.htm
.
95.
OECD.
OECD median household income comparison. (2024)
Median household disposable income varies significantly across OECD nations: United States: $77,500 (2023) Switzerland: $55,000 PPP-adjusted (lower nominal but comparable purchasing power) Singapore: $75,000 PPP-adjusted Additional sources: https://data.oecd.org/hha/household-disposable-income.htm
.
96.
Cato Institute. Chance of dying from terrorism statistic.
Cato Institute: Terrorism and Immigration Risk Analysis https://www.cato.org/policy-analysis/terrorism-immigration-risk-analysis Chance of American dying in foreign-born terrorist attack: 1 in 3.6 million per year (1975-2015) Including 9/11 deaths; annual murder rate is 253x higher than terrorism death rate More likely to die from lightning strike than foreign terrorism Note: Comprehensive 41-year study shows terrorism risk is extremely low compared to everyday dangers Additional sources: https://www.cato.org/policy-analysis/terrorism-immigration-risk-analysis | https://www.nbcnews.com/news/us-news/you-re-more-likely-die-choking-be-killed-foreign-terrorists-n715141
.
97.
Wikipedia. Thalidomide scandal: Worldwide cases and mortality.
Wikipedia https://en.wikipedia.org/wiki/Thalidomide_scandal The total number of embryos affected by the use of thalidomide during pregnancy is estimated at 10,000, of whom about 40% died around the time of birth. More than 10,000 children in 46 countries were born with deformities such as phocomelia. Additional sources: https://en.wikipedia.org/wiki/Thalidomide_scandal
.
98.
PLOS One. Health and quality of life of thalidomide survivors as they age.
PLOS One https://journals.plos.org/plosone/article?id=10.1371/journal.pone.0210222 (2019)
Study of thalidomide survivors documenting ongoing disability impacts, quality of life, and long-term health outcomes. Survivors (now in their 60s) continue to experience significant disability from limb deformities, organ damage, and other effects. Additional sources: https://journals.plos.org/plosone/article?id=10.1371/journal.pone.0210222
.
100.
FDA Study via NCBI. Trial costs, FDA study.
FDA Study via NCBI https://www.ncbi.nlm.nih.gov/pmc/articles/PMC6248200/ Overall, the 138 clinical trials had an estimated median (IQR) cost of $19.0 million ($12.2 million-$33.1 million)... The clinical trials cost a median (IQR) of $41,117 ($31,802-$82,362) per patient. Additional sources: https://www.ncbi.nlm.nih.gov/pmc/articles/PMC6248200/
.
101.
GBD 2019 Diseases and Injuries Collaborators.
Global burden of disease study 2019: Disability weights.
The Lancet 396, 1204–1222 (2020)
Disability weights for 235 health states used in Global Burden of Disease calculations. Weights range from 0 (perfect health) to 1 (death equivalent). Chronic conditions like diabetes (0.05-0.35), COPD (0.04-0.41), depression (0.15-0.66), and cardiovascular disease (0.04-0.57) show substantial variation by severity. Treatment typically reduces disability weights by 50-80 percent for manageable chronic conditions.
102.
WHO. Annual global economic burden of alzheimer’s and other dementias.
WHO: Dementia Fact Sheet https://www.who.int/news-room/fact-sheets/detail/dementia (2019)
Global cost: $1.3 trillion (2019 WHO-commissioned study) 50% from informal caregivers (family/friends, 5 hrs/day) 74% of costs in high-income countries despite 61% of patients in LMICs $818B (2010) → $1T (2018) → $1.3T (2019) - rapid growth Note: Costs increased 35% from 2010-2015 alone. Informal care represents massive hidden economic burden Additional sources: https://www.who.int/news-room/fact-sheets/detail/dementia | https://alz-journals.onlinelibrary.wiley.com/doi/10.1002/alz.12901
.
103.
JAMA Oncology. Annual global economic burden of cancer.
JAMA Oncology: Global Cost 2020-2050 https://jamanetwork.com/journals/jamaoncology/fullarticle/2801798 (2020)
2020-2050 projection: $25.2 trillion total ($840B/year average) 2010 annual cost: $1.16 trillion (direct costs only) Recent estimate: $3 trillion/year (all costs included) Top 5 cancers: lung (15.4%), colon/rectum (10.9%), breast (7.7%), liver (6.5%), leukemia (6.3%) Note: China/US account for 45% of global burden; 75% of deaths in LMICs but only 50.0% of economic cost Additional sources: https://jamanetwork.com/journals/jamaoncology/fullarticle/2801798 | https://www.nature.com/articles/d41586-023-00634-9
.
105.
Diabetes Care. Annual global economic burden of diabetes.
Diabetes Care: Global Economic Burden https://diabetesjournals.org/care/article/41/5/963/36522/Global-Economic-Burden-of-Diabetes-in-Adults 2015: $1.3 trillion (1.8% of global GDP) 2030 projections: $2.1T-2.5T depending on scenario IDF health expenditure: $760B (2019) → $845B (2045 projected) 2/3 direct medical costs ($857B), 1/3 indirect costs (lost productivity) Note: Costs growing rapidly; expected to exceed $2T by 2030 Additional sources: https://diabetesjournals.org/care/article/41/5/963/36522/Global-Economic-Burden-of-Diabetes-in-Adults | https://doi.org/10.1016/S2213-8587(17)30097-9
.
107.
World Bank, Bureau of Economic Analysis. US GDP 2024 ($28.78 trillion).
World Bank https://data.worldbank.org/indicator/NY.GDP.MKTP.CD?locations=US (2024)
US GDP reached $28.78 trillion in 2024, representing approximately 26% of global GDP. Additional sources: https://data.worldbank.org/indicator/NY.GDP.MKTP.CD?locations=US | https://www.bea.gov/news/2024/gross-domestic-product-fourth-quarter-and-year-2024-advance-estimate
.
108.
Environmental Working Group. US farm subsidy database and analysis.
Environmental Working Group https://farm.ewg.org/ (2024)
US agricultural subsidies total approximately $30 billion annually, but create much larger economic distortions. Top 10% of farms receive 78% of subsidies, benefits concentrated in commodity crops (corn, soy, wheat, cotton), environmental damage from monoculture incentivized, and overall deadweight loss estimated at $50-120 billion annually. Additional sources: https://farm.ewg.org/ | https://www.ers.usda.gov/topics/farm-economy/farm-sector-income-finances/government-payments-the-safety-net/
.
109.
Drug Policy Alliance.
The drug war by the numbers. (2021)
Since 1971, the war on drugs has cost the United States an estimated $1 trillion in enforcement. The federal drug control budget was $41 billion in 2022. Mass incarceration costs the U.S. at least $182 billion every year, with over $450 billion spent to incarcerate individuals on drug charges in federal prisons.
110.
International Monetary Fund.
IMF fossil fuel subsidies data: 2023 update. (2023)
Globally, fossil fuel subsidies were $7 trillion in 2022 or 7.1 percent of GDP. The United States subsidies totaled $649 billion. Underpricing for local air pollution costs and climate damages are the largest contributor, accounting for about 30 percent each.
111.
Papanicolas, Irene et al. Health care spending in the united states and other high-income countries.
Papanicolas et al. https://jamanetwork.com/journals/jama/article-abstract/2674671 (2018)
The US spent approximately twice as much as other high-income countries on medical care (mean per capita: $9,892 vs $5,289), with similar utilization but much higher prices. Administrative costs accounted for 8% of US spending vs 1-3% in other countries. US spending on pharmaceuticals was $1,443 per capita vs $749 elsewhere. Despite spending more, US health outcomes are not better. Additional sources: https://jamanetwork.com/journals/jama/article-abstract/2674671
.
112.
Hsieh, C.-T. & Moretti, E. Housing constraints and spatial misallocation.
American Economic Journal: Macroeconomics https://www.aeaweb.org/articles?id=10.1257/mac.20170388 (2019)
We quantify the amount of spatial misallocation of labor across US cities and its aggregate costs. Tight land-use restrictions in high-productivity cities like New York, San Francisco, and Boston lowered aggregate US growth by 36% from 1964 to 2009. Local constraints on housing supply have had enormous effects on the national economy. Additional sources: https://www.aeaweb.org/articles?id=10.1257/mac.20170388
.
114.
Tax Foundation. Tax compliance costs the US economy $546 billion annually.
https://taxfoundation.org/data/all/federal/irs-tax-compliance-costs/ (2024)
Americans will spend over 7.9 billion hours complying with IRS tax filing and reporting requirements in 2024. This costs the economy roughly $413 billion in lost productivity. In addition, the IRS estimates that Americans spend roughly $133 billion annually in out-of-pocket costs, bringing the total compliance costs to $546 billion, or nearly 2 percent of GDP.
115.
Cook, C., Cole, G., Asaria, P., Jabbour, R. & Francis, D. P. Annual global economic burden of heart disease.
International Journal of Cardiology https://www.internationaljournalofcardiology.com/article/S0167-5273(13)02238-9/abstract (2014)
Heart failure alone: $108 billion/year (2012 global analysis, 197 countries) US CVD: $555B (2016) → projected $1.8T by 2050 LMICs total CVD loss: $3.7T cumulative (2011-2015, 5-year period) CVD is costliest disease category in most developed nations Note: No single $2.1T global figure found; estimates vary widely by scope and year Additional sources: https://www.ahajournals.org/doi/10.1161/CIR.0000000000001258
.
116.
Source: US Life Expectancy FDA Budget 1543-2019 CSV.
US life expectancy growth 1880-1960: 3.82 years per decade. (2019)
Pre-1962: 3.82 years/decade Post-1962: 1.54 years/decade Reduction: 60% decline in life expectancy growth rate Additional sources: https://ourworldindata.org/life-expectancy | https://www.mortality.org/ | https://www.cdc.gov/nchs/nvss/mortality_tables.htm
.
117.
Source: US Life Expectancy FDA Budget 1543-2019 CSV.
Post-1962 slowdown in life expectancy gains. (2019)
Pre-1962 (1880-1960): 3.82 years/decade Post-1962 (1962-2019): 1.54 years/decade Reduction: 60% decline Temporal correlation: Slowdown occurred immediately after 1962 Kefauver-Harris Amendment Additional sources: https://ourworldindata.org/life-expectancy | https://www.mortality.org/ | https://www.cdc.gov/nchs/nvss/mortality_tables.htm
.
118.
Centers for Disease Control and Prevention.
US life expectancy 2023. (2024)
US life expectancy at birth was 77.5 years in 2023 Male life expectancy: 74.8 years Female life expectancy: 80.2 years This is 6-7 years lower than peer developed nations despite higher healthcare spending Additional sources: https://www.cdc.gov/nchs/fastats/life-expectancy.htm
.
119.
US Census Bureau.
US median household income 2023. (2024)
US median household income was $77,500 in 2023 Real median household income declined 0.8% from 2022 Gini index: 0.467 (income inequality measure) Additional sources: https://www.census.gov/library/publications/2024/demo/p60-282.html
.
120.
Manuel, D. U.s. Defense spending history: 100 years of military budgets.
DaveManuel.com https://www.davemanuel.com/us-defense-spending-history-military-budget-data.php (2025)
US military spending in constant 2024 dollars: 1939 $29B (pre-WW2 baseline), 1940 $37B, 1944 $1,383B, 1945 $1,420B (peak), 1946 $674B, 1947 $176B, 1948 $117B, 2024 $886B. The post-WW2 demobilization cut spending 88% in two years (1945-1947). Current peacetime spending ($886B) is 30x the pre-WW2 baseline and 62% of peak WW2 spending, in inflation-adjusted dollars.
121.
Statista. US military budget as percentage of GDP.
Statista https://www.statista.com/statistics/262742/countries-with-the-highest-military-spending/ (2024)
U.S. military spending amounted to 3.5% of GDP in 2024. In 2024, the U.S. spent nearly $1 trillion on its military budget, equal to 3.4% of GDP. Additional sources: https://www.statista.com/statistics/262742/countries-with-the-highest-military-spending/ | https://www.sipri.org/sites/default/files/2025-04/2504_fs_milex_2024.pdf
.
122.
US Census Bureau. Number of registered or eligible voters in the u.s.
US Census Bureau https://www.census.gov/newsroom/press-releases/2025/2024-presidential-election-voting-registration-tables.html (2024)
73.6% (or 174 million people) of the citizen voting-age population was registered to vote in 2024 (Census Bureau). More than 211 million citizens were active registered voters (86.6% of citizen voting age population) according to the Election Assistance Commission. Additional sources: https://www.census.gov/newsroom/press-releases/2025/2024-presidential-election-voting-registration-tables.html | https://www.eac.gov/news/2025/06/30/us-election-assistance-commission-releases-2024-election-administration-and-voting
.
123.
U.S. Senate. Treaties.
U.S. Senate https://www.senate.gov/about/powers-procedures/treaties.htm The Constitution provides that the president ’shall have Power, by and with the Advice and Consent of the Senate, to make Treaties, provided two-thirds of the Senators present concur’ (Article II, section 2). Treaties are formal agreements with foreign nations that require two-thirds Senate approval. 67 senators (two-thirds of 100) must vote to ratify a treaty for it to take effect. Additional sources: https://www.senate.gov/about/powers-procedures/treaties.htm
.
124.
Federal Election Commission.
Statistical summary of 24-month campaign activity of the 2023-2024 election cycle. (2023)
Presidential candidates raised $2 billion; House and Senate candidates raised $3.8 billion and spent $3.7 billion; PACs raised $15.7 billion and spent $15.5 billion. Total federal campaign spending approximately $20 billion. Additional sources: https://www.fec.gov/updates/statistical-summary-of-24-month-campaign-activity-of-the-2023-2024-election-cycle/
.
125.
OpenSecrets.
Federal lobbying hit record $4.4 billion in 2024. (2024)
Total federal lobbying reached record $4.4 billion in 2024. The $150 million increase in lobbying continues an upward trend that began in 2016. Additional sources: https://www.opensecrets.org/news/2025/02/federal-lobbying-set-new-record-in-2024/
.
126.
Columbia/NBER. Odds of a single vote being decisive in a u.s. Presidential election.
Columbia/NBER: What Is the Probability Your Vote Will Make a Difference? https://sites.stat.columbia.edu/gelman/research/published/probdecisive2.pdf (2012)
National average: 1 in 60 million chance (2008 election analysis by Gelman, Silver, Edlin) Swing states (NM, VA, NH, CO): 1 in 10 million chance Non-competitive states: 34 states >1 in 100 million odds; 20 states >1 in 1 billion Washington DC: 1 in 490 billion odds Methodology: Probability state is necessary for electoral college win × probability state vote is tied Additional sources: https://sites.stat.columbia.edu/gelman/research/published/probdecisive2.pdf | https://onlinelibrary.wiley.com/doi/abs/10.1111/j.1465-7295.2010.00272.x
.
127.
Hutchinson and Kirk.
Valley of death in drug development. (2011)
The overall failure rate of drugs that passed into Phase 1 trials to final approval is 90%. This lack of translation from promising preclinical findings to success in human trials is known as the "valley of death." Estimated 30-50% of promising compounds never proceed to Phase 2/3 trials primarily due to funding barriers rather than scientific failure. The late-stage attrition rate for oncology drugs is as high as 70% in Phase II and 59% in Phase III trials.
128.
DOT. DOT value of statistical life ($13.6M).
DOT: VSL Guidance 2024 https://www.transportation.gov/office-policy/transportation-policy/revised-departmental-guidance-on-valuation-of-a-statistical-life-in-economic-analysis (2024)
Current VSL (2024): $13.7 million (updated from $13.6M) Used in cost-benefit analyses for transportation regulations and infrastructure Methodology updated in 2013 guidance, adjusted annually for inflation and real income VSL represents aggregate willingness to pay for safety improvements that reduce fatalities by one Note: DOT has published VSL guidance periodically since 1993. Current $13.7M reflects 2024 inflation/income adjustments Additional sources: https://www.transportation.gov/office-policy/transportation-policy/revised-departmental-guidance-on-valuation-of-a-statistical-life-in-economic-analysis | https://www.transportation.gov/regulations/economic-values-used-in-analysis
.
129.
PLOS ONE. Cost per DALY for vitamin a supplementation.
PLOS ONE: Cost-effectiveness of "Golden Mustard" for Treating Vitamin A Deficiency in India (2010) https://journals.plos.org/plosone/article?id=10.1371/journal.pone.0012046 (2010)
India: $23-$50 per DALY averted (least costly intervention, $1,000-$6,100 per death averted) Sub-Saharan Africa (2022): $220-$860 per DALY (Burkina Faso: $220, Kenya: $550, Nigeria: $860) WHO estimates for Africa: $40 per DALY for fortification, $255 for supplementation Uganda fortification: $18-$82 per DALY (oil: $18, sugar: $82) Note: Wide variation reflects differences in baseline VAD prevalence, coverage levels, and whether intervention is supplementation or fortification Additional sources: https://journals.plos.org/plosone/article?id=10.1371/journal.pone.0012046 | https://journals.plos.org/plosone/article?id=10.1371/journal.pone.0266495
.
131.
PMC. Cost-effectiveness threshold ($50,000/QALY).
PMC https://pmc.ncbi.nlm.nih.gov/articles/PMC5193154/ The $50,000/QALY threshold is widely used in US health economics literature, originating from dialysis cost benchmarks in the 1980s. In US cost-utility analyses, 77.5% of authors use either $50,000 or $100,000 per QALY as reference points. Most successful health programs cost $3,000-10,000 per QALY. WHO-CHOICE uses GDP per capita multiples (1× GDP/capita = "very cost-effective", 3× GDP/capita = "cost-effective"), which for the US ( $70,000 GDP/capita) translates to $70,000-$210,000/QALY thresholds. Additional sources: https://pmc.ncbi.nlm.nih.gov/articles/PMC5193154/ | https://pmc.ncbi.nlm.nih.gov/articles/PMC9278384/
.
132.
Integrated Benefits Institute. Chronic illness workforce productivity loss.
Integrated Benefits Institute 2024 https://www.ibiweb.org/resources/chronic-conditions-in-the-us-workforce-prevalence-trends-and-productivity-impacts (2024)
78.4% of U.S. employees have at least one chronic condition (7% increase since 2021) 58% of employees report physical chronic health conditions 28% of all employees experience productivity loss due to chronic conditions Average productivity loss: $4,798 per employee per year Employees with 3+ chronic conditions miss 7.8 days annually vs 2.2 days for those without Note: 28% productivity loss translates to roughly 11 hours per week (28% of 40-hour workweek) Additional sources: https://www.ibiweb.org/resources/chronic-conditions-in-the-us-workforce-prevalence-trends-and-productivity-impacts | https://www.onemedical.com/mediacenter/study-finds-more-than-half-of-employees-are-living-with-chronic-conditions-including-1-in-3-gen-z-and-millennial-employees/ | https://debeaumont.org/news/2025/poll-the-toll-of-chronic-health-conditions-on-employees-and-workplaces/
.
135.
Del Rosal, I. The empirical measurement of rent-seeking costs.
Journal of Economic Surveys https://onlinelibrary.wiley.com/doi/abs/10.1111/j.1467-6419.2009.00621.x (2011)
A comprehensive survey of empirical estimates finds rent-seeking costs range from 0.2% to 23.7% of GDP across different methodologies and countries. Laband & Sophocleus (1988) estimated up to 45% for the US.
136.
Hayek, F. A.
The use of knowledge in society.
American Economic Review 35, 519–530 (1945)
The knowledge of the circumstances which we must make use of never exists in concentrated or integrated form but solely as dispersed bits of incomplete and frequently contradictory knowledge which all the separate individuals possess.
137.
Coffey, B., McLaughlin, P. A. & Peretto, P. F.
The cumulative cost of regulations.
Review of Economic Dynamics 38, 1–21 (2020)
Regulatory restrictions have had a net effect of dampening economic growth by approximately 0.8 percent per annum since 1980... Had regulation been held constant at levels observed in 1980, the economy would have been nearly 25 percent larger by 2012 (i.e., regulatory growth since 1980 cost GDP $4 trillion in 2012, or about $13,000 per capita).
138.
Dawson, J. W. & Seater, J. J.
Federal regulation and aggregate economic growth.
Journal of Economic Growth 18, 137–177 (2013)
Federal regulations added over the past fifty years have reduced real output growth by about two percentage points on average annually over the period 1949-2005... GDP at the end of 2011 would have been $53.9 trillion instead of $15.1 trillion if regulation had remained at its 1949 level.
140.
Philipson, T., Berndt, E. R., Gottschalk, A. H. & Sun, E.
Cost-benefit analysis of the FDA: The case of the prescription drug user fee acts.
Journal of Public Economics 92, 1306–1325 (2008)
Faster drug approvals under PDUFA saved 140,000 to 310,000 life years from patients who had more rapid access to drugs, though this benefit was partially offset by an estimated 56,000 life years lost due to adverse events... Consumer welfare increased between $7 billion and $20 billion.
143.
S&P Dow Jones Indices.
SPIVA u.s. Scorecard year-end 2023. (2023)
Over the 15-year period ending Dec. 2023, 87.98% of large-cap U.S. equity funds underperformed the S&P 500. The longer the time horizon, the more difficult it becomes for active managers to outperform. SPIVA (S&P Indices Versus Active) provides the de facto scorecard for the active vs. passive debate. Additional sources: https://www.spglobal.com/spdji/en/research-insights/spiva/
.
145.
Goodhart, C. A. E. Problems of monetary management: The UK experience. Monetary Theory and Practice 91–121 (1984).
146.
Coase, R. H.
The problem of social cost.
Ronald H. Coase 3, 1–44 (1960)
The Problem of Social Cost" established that in the absence of transaction costs, parties will bargain to efficient outcomes regardless of initial property rights. This foundational insight—known as the Coase Theorem—demonstrates that inefficient allocation persists due to transaction costs (information, negotiation, enforcement), not due to the allocation problem itself. The theorem implies that welfare-improving reforms are theoretically achievable through compensation schemes that make all parties better off. Additional sources: https://www.jstor.org/stable/724810
.
147.
The Nation. The pentagon’s revolving door keeps spinning.
The Nation https://www.pogo.org/analyses/the-pentagons-revolving-door-keeps-spinning-2021-in-review (2021)
From 2009 to 2019, approximately 380 high-ranking Department of Defense officials and military officers transitioned to become lobbyists, board members, executives, or consultants for military contractors. Former members of Congress routinely transition to lucrative lobbying and consulting careers in the defense sector, with compensation often 10-20 times their congressional salary. Additional sources: https://www.pogo.org/analyses/the-pentagons-revolving-door-keeps-spinning-2021-in-review
.
148.
Mulcahy, A. W., Schwam, D. & Edenfield, N.
International prescription drug price comparisons. (2021)
US drug prices were 256% of prices in 32 OECD comparison countries. For brand-name drugs, US prices were 344% of comparison country prices. For unbranded generics, US prices were 84% of comparison prices. Potential annual savings from reference pricing policies estimated at $100 billion or more. Additional sources: https://www.rand.org/pubs/research_reports/RR2956.html
.
149.
Arrow, K. J.
Social Choice and Individual Values. (Kenneth J. Arrow, 1951).
Arrow’s Impossibility Theorem proves that no rank-order voting system can satisfy all of four "fairness" criteria: unrestricted domain, non-dictatorship, Pareto efficiency, and independence of irrelevant alternatives. This foundational result in social choice theory demonstrates that there is no perfect method for aggregating individual preferences into collective decisions—all voting systems involve tradeoffs. The theorem has profound implications for democratic theory, welfare economics, and mechanism design, showing that preference aggregation is irreducibly political. Additional sources: https://www.amazon.com/Social-Choice-Individual-Values-Monograph/dp/0300013647
.
150.
Gibbard, A.
Manipulation of voting schemes: A general result.
Econometrica 41, 587–601 (1973)
Gibbard proved that any deterministic voting scheme with at least three possible outcomes is either dictatorial or manipulable (i.e., voters can sometimes benefit by misrepresenting their preferences). This result, proven independently by Satterthwaite (1975), establishes fundamental limits on voting mechanisms: strategic voting cannot be eliminated from any non-trivial democratic system. The theorem has profound implications for mechanism design and social choice theory.
151.
Myerson, R. B.
Optimal auction design.
Mathematics of Operations Research 6, 58–73 (1981)
This seminal paper establishes the Revenue Equivalence Theorem and introduces the "virtual valuation" concept for mechanism design. Myerson shows how to design auctions that maximize expected revenue given incentive-compatible reporting constraints. The paper, along with the Revelation Principle, provides foundational tools for designing mechanisms where agents truthfully report private information. Essential for understanding incentive-compatible oracle design in algorithmic governance systems.
152.
Maskin, E. Nash equilibrium and welfare optimality. Review of Economic Studies 66, 23–38 (1999).
Appendix B: Theoretical Background
This appendix provides deeper theoretical context for readers interested in the academic foundations and historical precedents. The main text presents the mechanism; this appendix addresses why alternative approaches have failed and engages with theoretical objections.
Historical Precedents: Technocratic Governance Failures
Soviet Central Planning
The Soviet system attempted comprehensive optimization: central planners would calculate optimal production quantities and allocate resources accordingly. The failure was comprehensive:
- Knowledge problem136: Planners lacked the distributed information that prices aggregate in markets.
- Incentive problem: Planners had no personal stake in outcomes and faced perverse incentives.
- Scope problem: Central planning attempted to optimize everything, including decisions where local knowledge is essential.
Why Optimocracy differs: Optimocracy doesn’t replace markets or local decision-making. It optimizes budget allocation and policy recommendations where centralized data is sufficient, while preserving market mechanisms for production decisions. The algorithm recommends; politicians and markets decide.
Credit Rating Agencies (1990s-2008)
Credit ratings were supposed to be objective, algorithmic assessments of default risk. Instead:
- Incentive misalignment: Agencies were paid by issuers (those being rated)
- Metric gaming: Financial engineers designed securities to maximize ratings while hiding risk
- Capture: Rating models were “optimized” to give favorable ratings, not accurate risk assessment
What Optimocracy learns: Use median aggregation across multiple independent sources with different governance structures. No single entity controls measurement.
Engaging with Impossibility Theorems
Arrow and Gibbard-Satterthwaite
149 proved no voting rule perfectly aggregates conflicting preferences.150 showed any voting rule can be strategically gamed.
Why these don’t apply: Health and wealth are not contested values in the Arrow sense. They are near-universal instrumental goods. Nobody campaigns on “Vote for me, I’ll make you sicker and poorer.” The debate is always about how to achieve health and wealth, never whether they’re good.
The challenge shifts from “what should we optimize?” (self-evident) to “how do we measure it honestly?” (oracle design). That’s an implementation problem, not a social choice problem.
Mechanism Design: The Revelation Principle
The Revelation Principle151,152 states that data reporters only tell the truth when lying costs more than it’s worth.
What this means for Optimocracy:
- Data reporters need incentives for truth-telling
- Multiple independent sources reduce manipulation risk
- Perfect honesty may be impossible; we only claim manipulation costs exceed the cost of corrupting political systems
Democratic Legitimacy: A Deeper Analysis
The concern is not whether Optimocracy would work technically, but whether citizens would accept it as legitimate governance. Democratic theorists from Rousseau to Habermas argue that the process of collective decision-making has intrinsic value.
The objection has real force. On this view, a benevolent dictator who maximized welfare would still be illegitimate because citizens didn’t author their own laws.
Responses:
| More democratic, not less |
Current system offers ritual (voting) but delivers oligarchy (133). Optimocracy delivers what citizens actually voted for. |
| Citizens choose the goal |
We already delegate implementation to the Fed and FDA. |
| Universal values |
Health and wealth aren’t contested preferences. We’re measuring what humans universally value. |
| Legitimacy evolves |
Social Security and index funds were controversial initially. |
| The alternative is capture |
The realistic choice is captured allocation dressed in democratic ritual. |
There is a genuine tension between outcome legitimacy (governance produces outcomes citizens want) and process legitimacy (citizens meaningfully participate in decisions). Optimocracy prioritizes outcome legitimacy while preserving process legitimacy through the wrapper architecture: politicians still decide everything; they just face new incentives and new information.
Boundary Conditions for Algorithmic Governance
The historical record suggests algorithmic governance works under specific conditions:
| Metric clarity |
Single, measurable objective |
Multiple, contested objectives |
| Knowledge requirements |
Aggregable statistics sufficient |
Distributed local knowledge essential |
| Value consensus |
Broad agreement on objective |
Fundamental value conflicts |
| Scope |
Narrow domain |
Comprehensive planning |
| Accountability |
Clear consequences for failure |
Diffuse responsibility |
Optimocracy operates in domains where conditions are favorable (budget allocation, policy evaluation) and defers to democratic deliberation where they are not (value conflicts, novel situations requiring judgment).